The leading graph visualization SDKs
Increase trust and confidence in your AI-powered application

"Most users don’t need – or maybe even want – to become AI or graph experts. They just want to get insight in the most effective way, understand where it came from, and make an informed decision.
Graph visualization is the natural way to present a lot of this information, revealing connections, relationships and sequences. There’s a great visual attraction too – people are drawn to graphs. It’s a rich, intuitive, and interactive format."
Fabien Vives, C3 AI
Enable your users to work with AI while staying confident and in control
Technology advances mean machines can process data, identify patterns, implement rules and generate recommendations faster than ever. But business-critical issues require human-led decisions and actions. And those humans need effective data visualization to decipher and understand AI-generated insights.
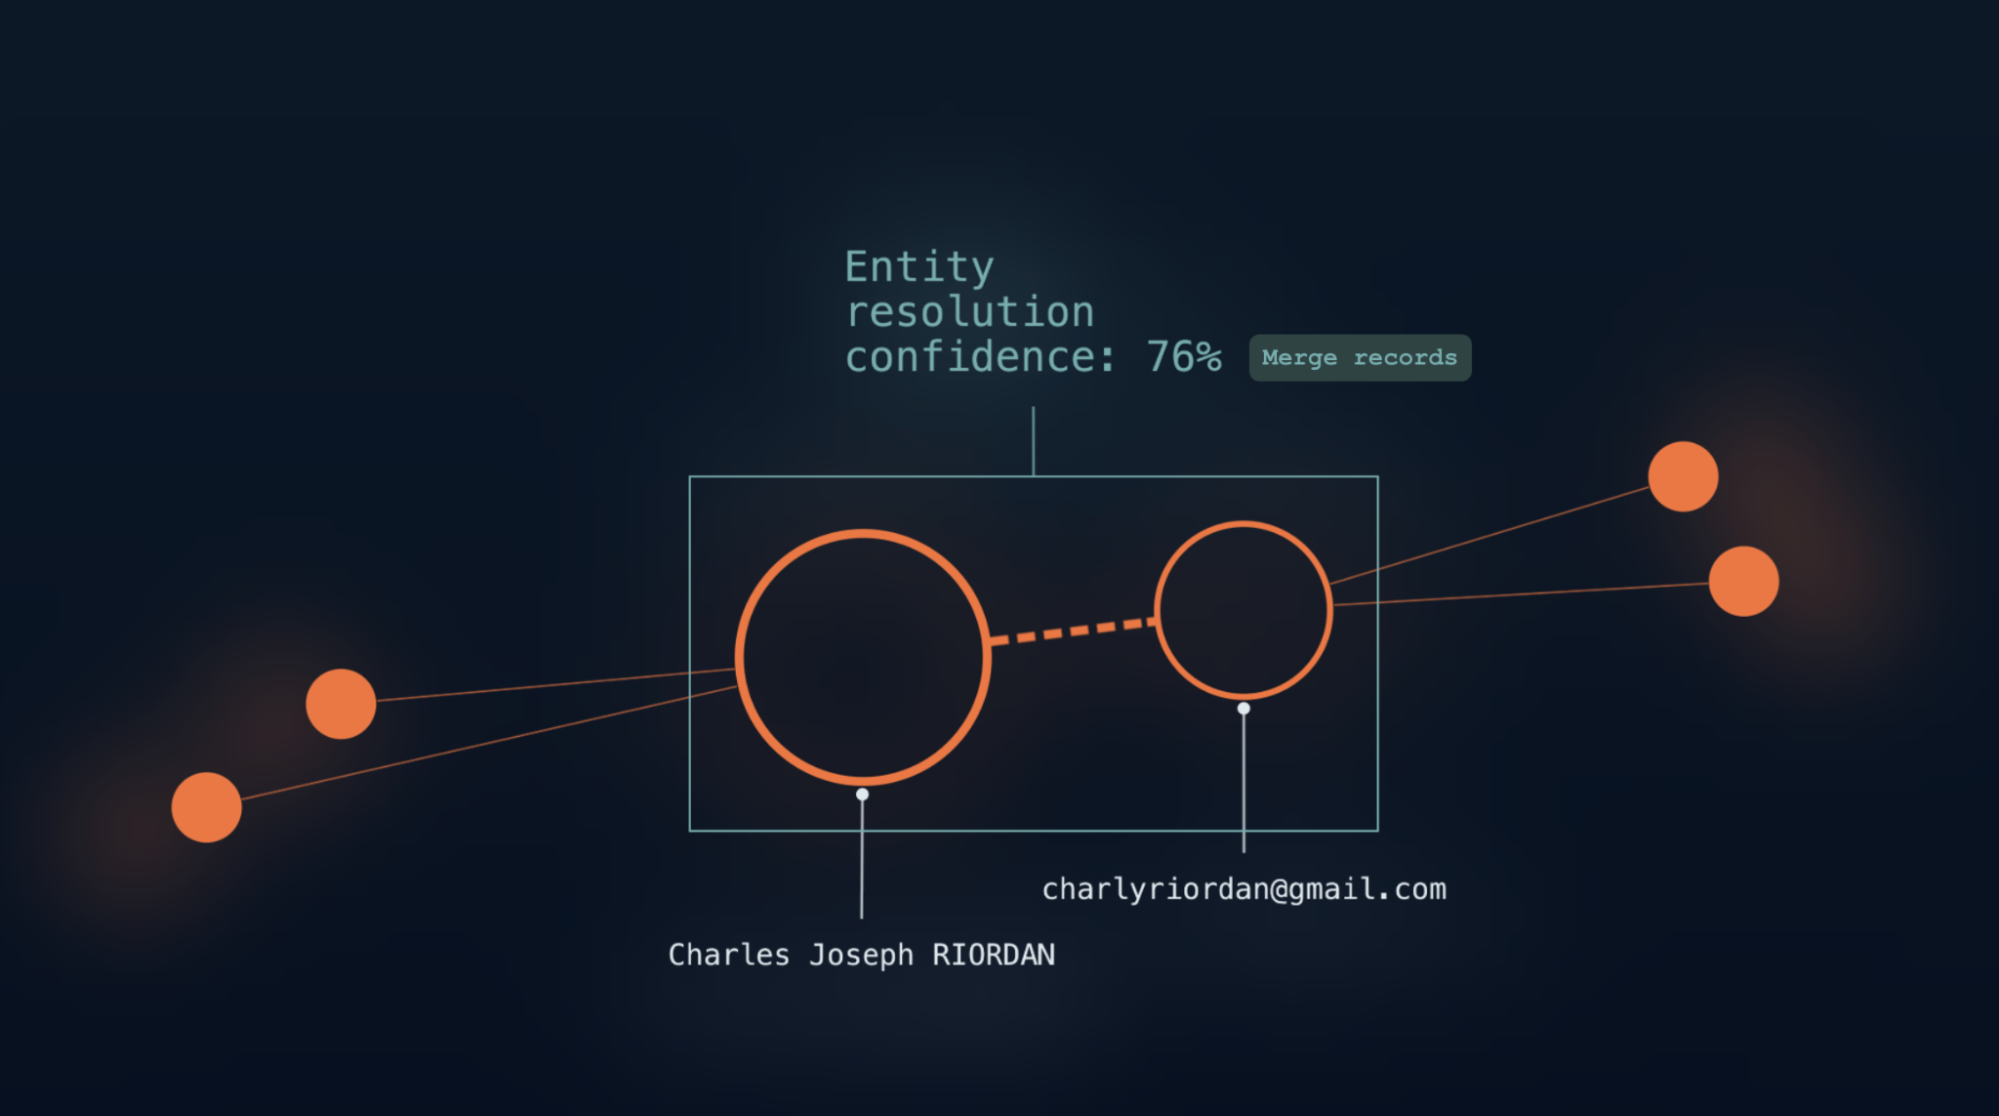
Build confidence in your automated data processing
To make informed decisions, users need to trust their data. But that trust can be fragile.
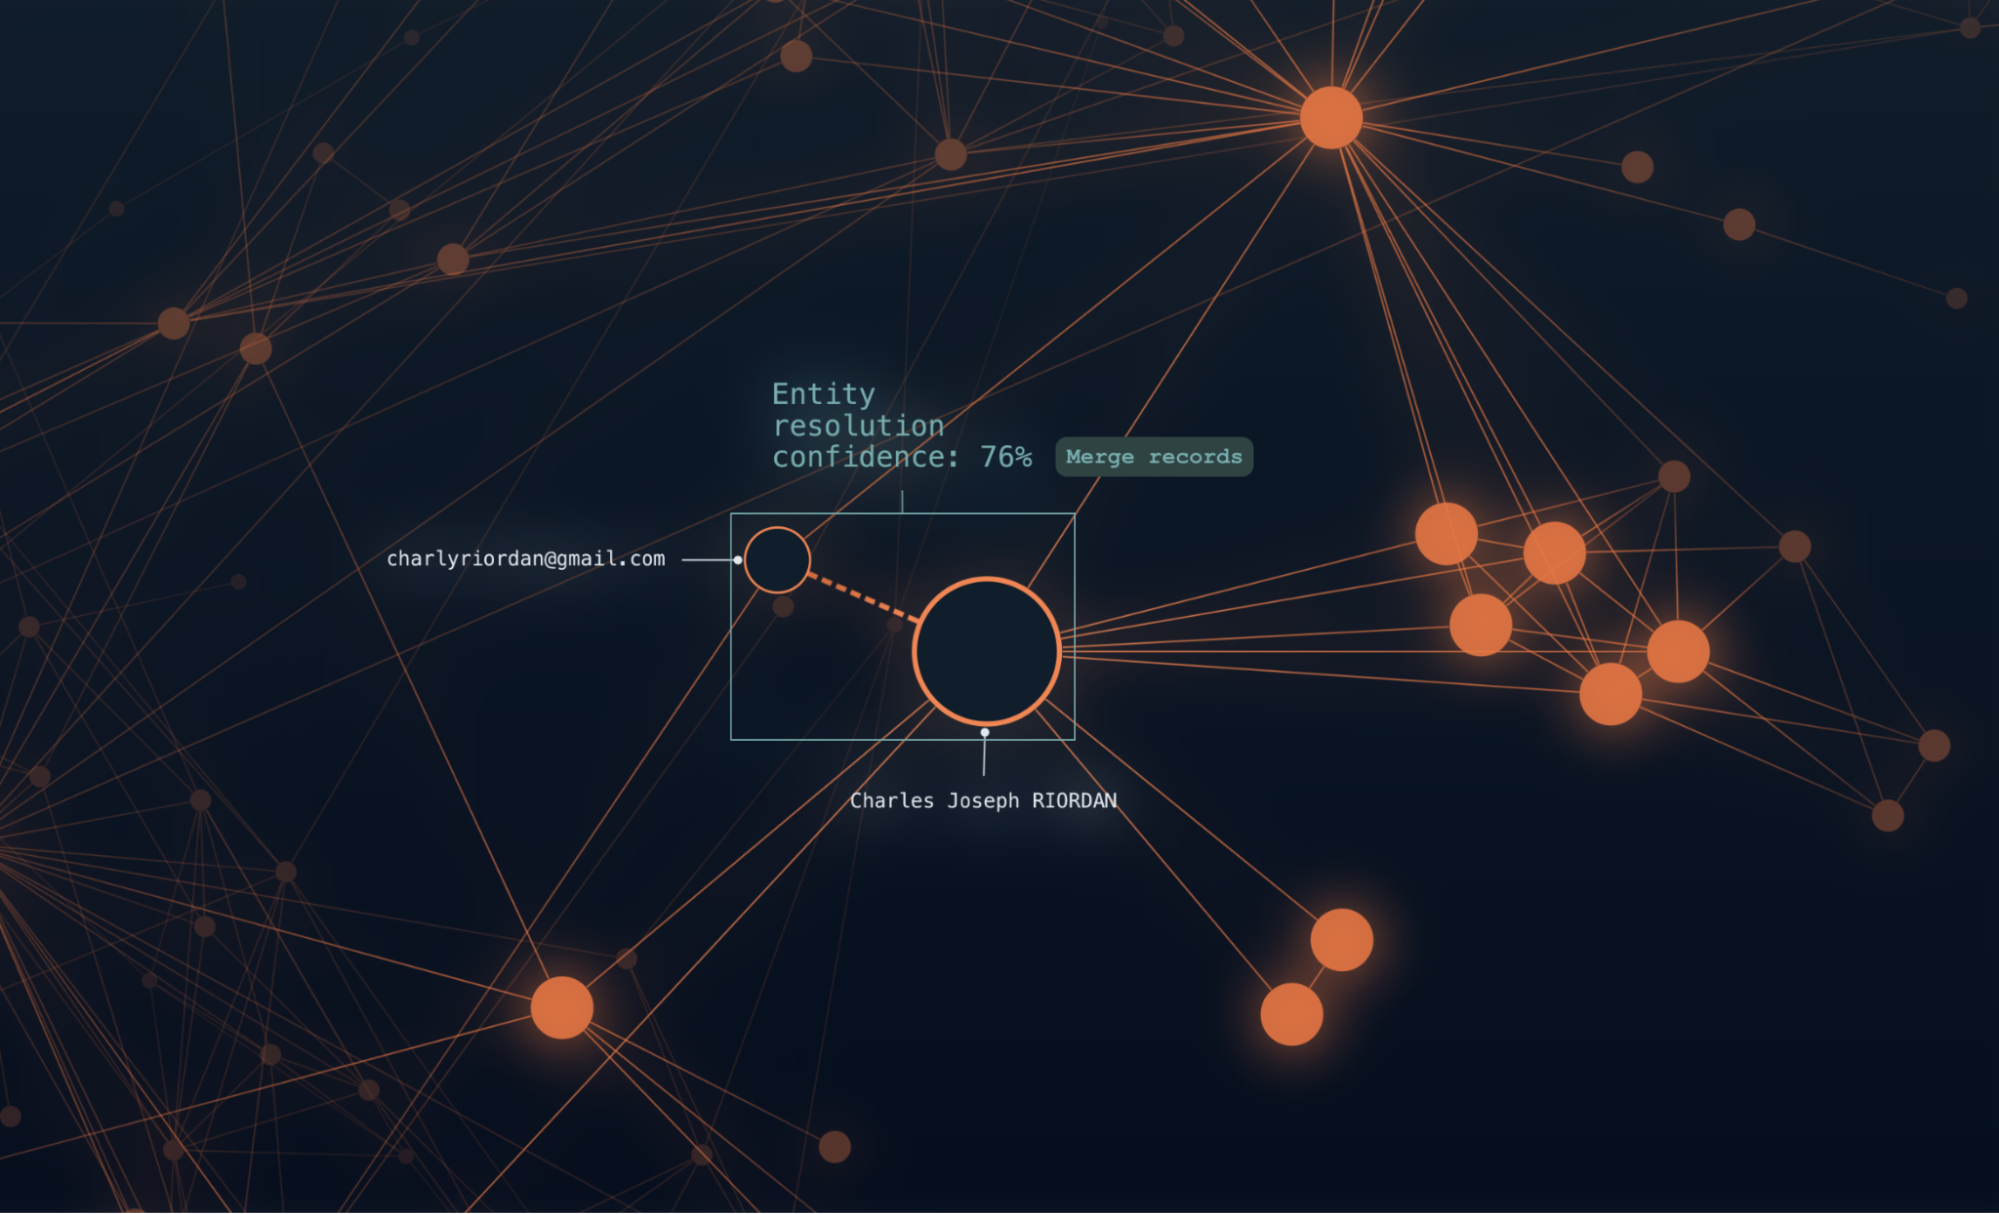
Graph visualization helps by making processes like entity resolution and data cleansing more transparent. With clear, intuitive graph UIs, users can see when records are merged or updated, understand the confidence levels behind automated decisions, and easily reverse any errors.
This clarity reassures analysts, allowing them to confidently use AI-driven processing without losing sight of the original data.

Turn pattern matching into transparent investigations
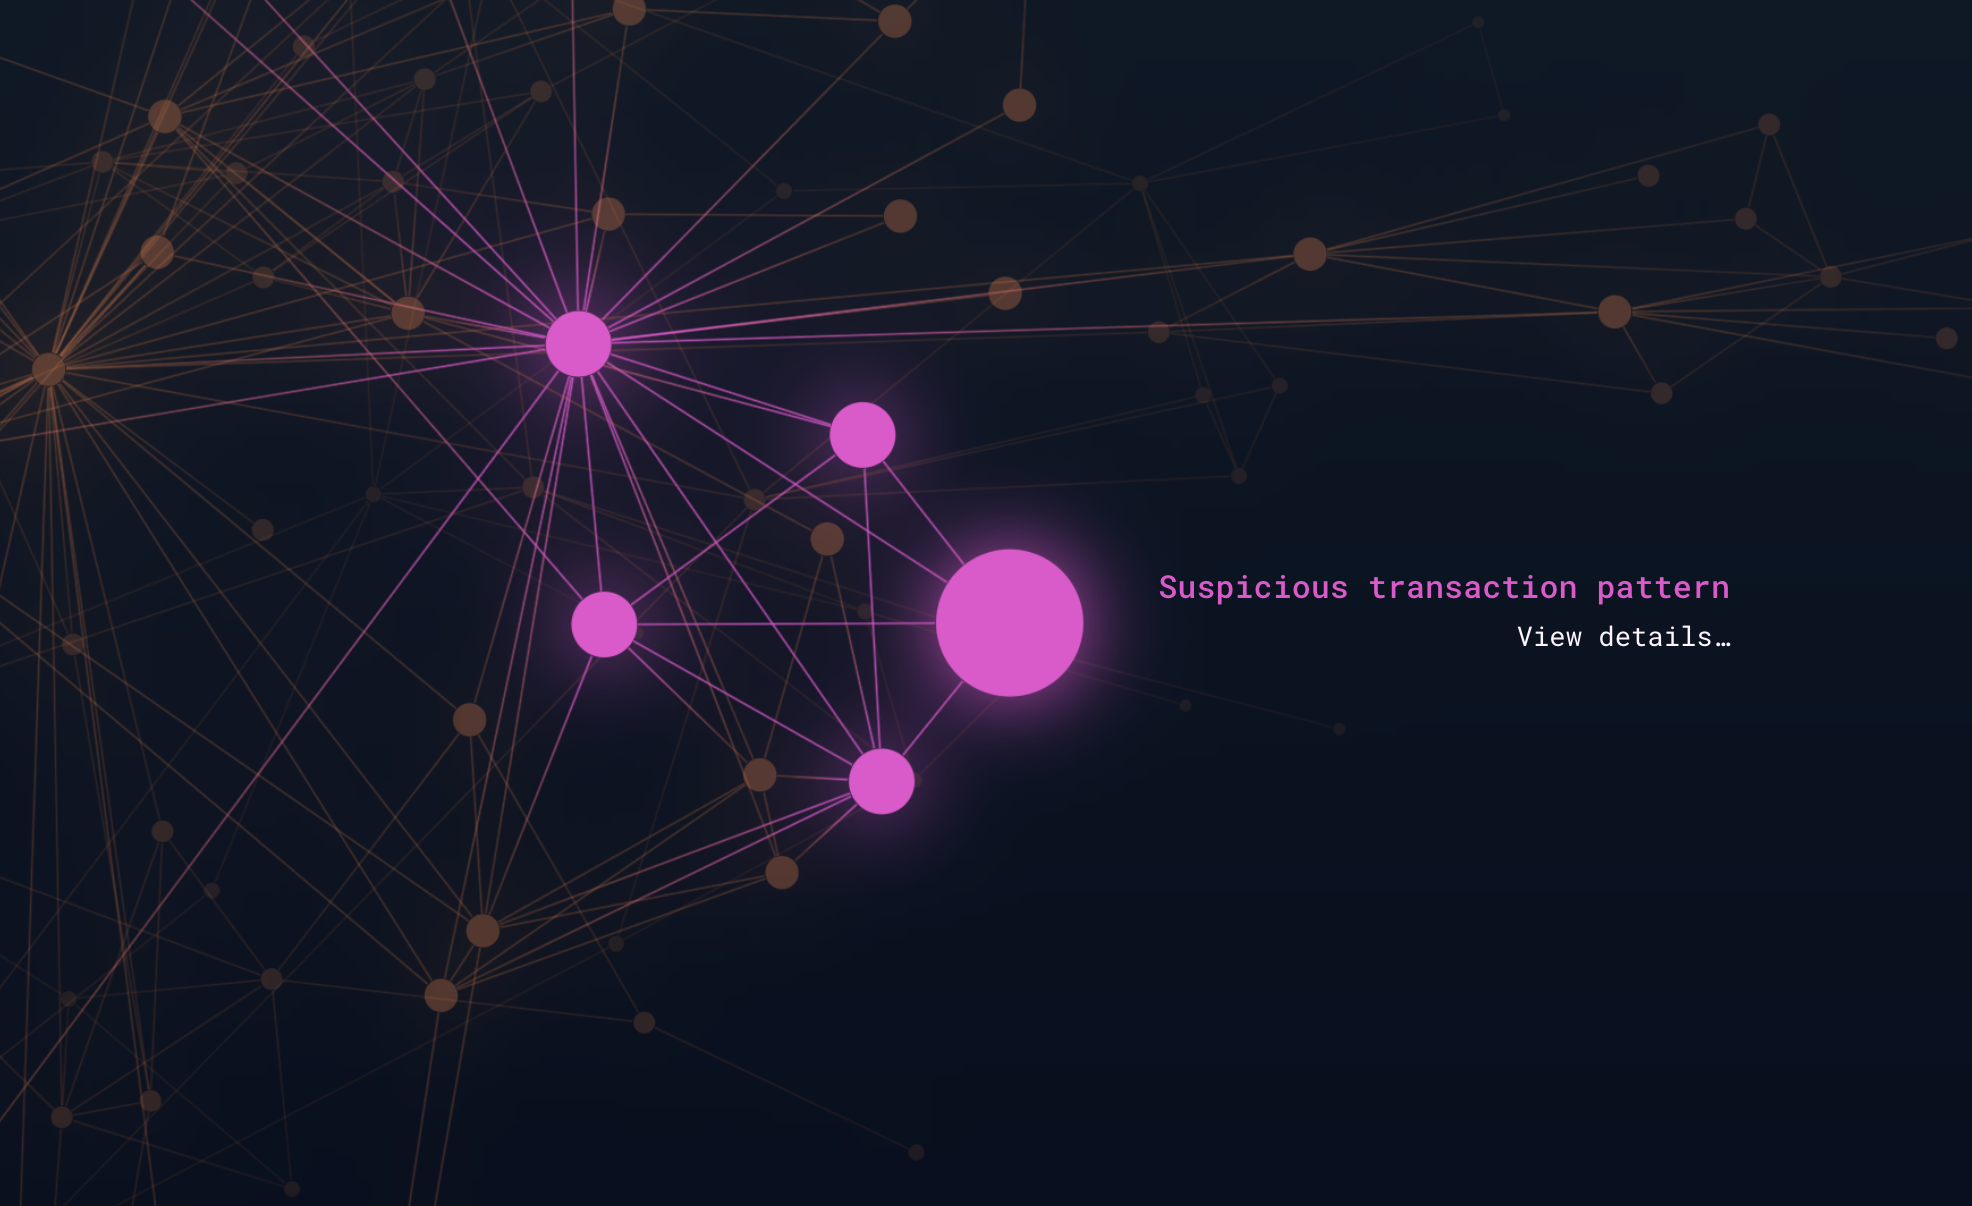
In the world of fraud detection and regulatory compliance, machine learning algorithms excel at spotting and classifying patterns.
But in regulated industries, where reporting and traceable decisions are vital, it’s not enough to simply detect suspicious patterns. They need to be investigated, explained, documented and supported by evidence.
Graph visualization is a powerful tool for these investigations, delivering clear, transparent insights and easy-to-understand visual reports that can be shared with stakeholders.

Put users back in control with visual graph analysis
Processes like natural language processing (NLP) and entity/relationship extraction are great at automating mundane tasks. They can search and categorize a huge corpus of documents in a fraction of the time it would take an investigation team.
But if the investigators don’t trust an AI’s ability to extract and categorize data correctly, their workflows won’t change.
Visual graph analysis lets users interact with data, putting them in control, and ensuring they - not the AI - make the final call.

Reduce alert fatigue with actionable insights
The speed and scale of AI and ML processes have intensified a long-standing issue: alert fatigue.
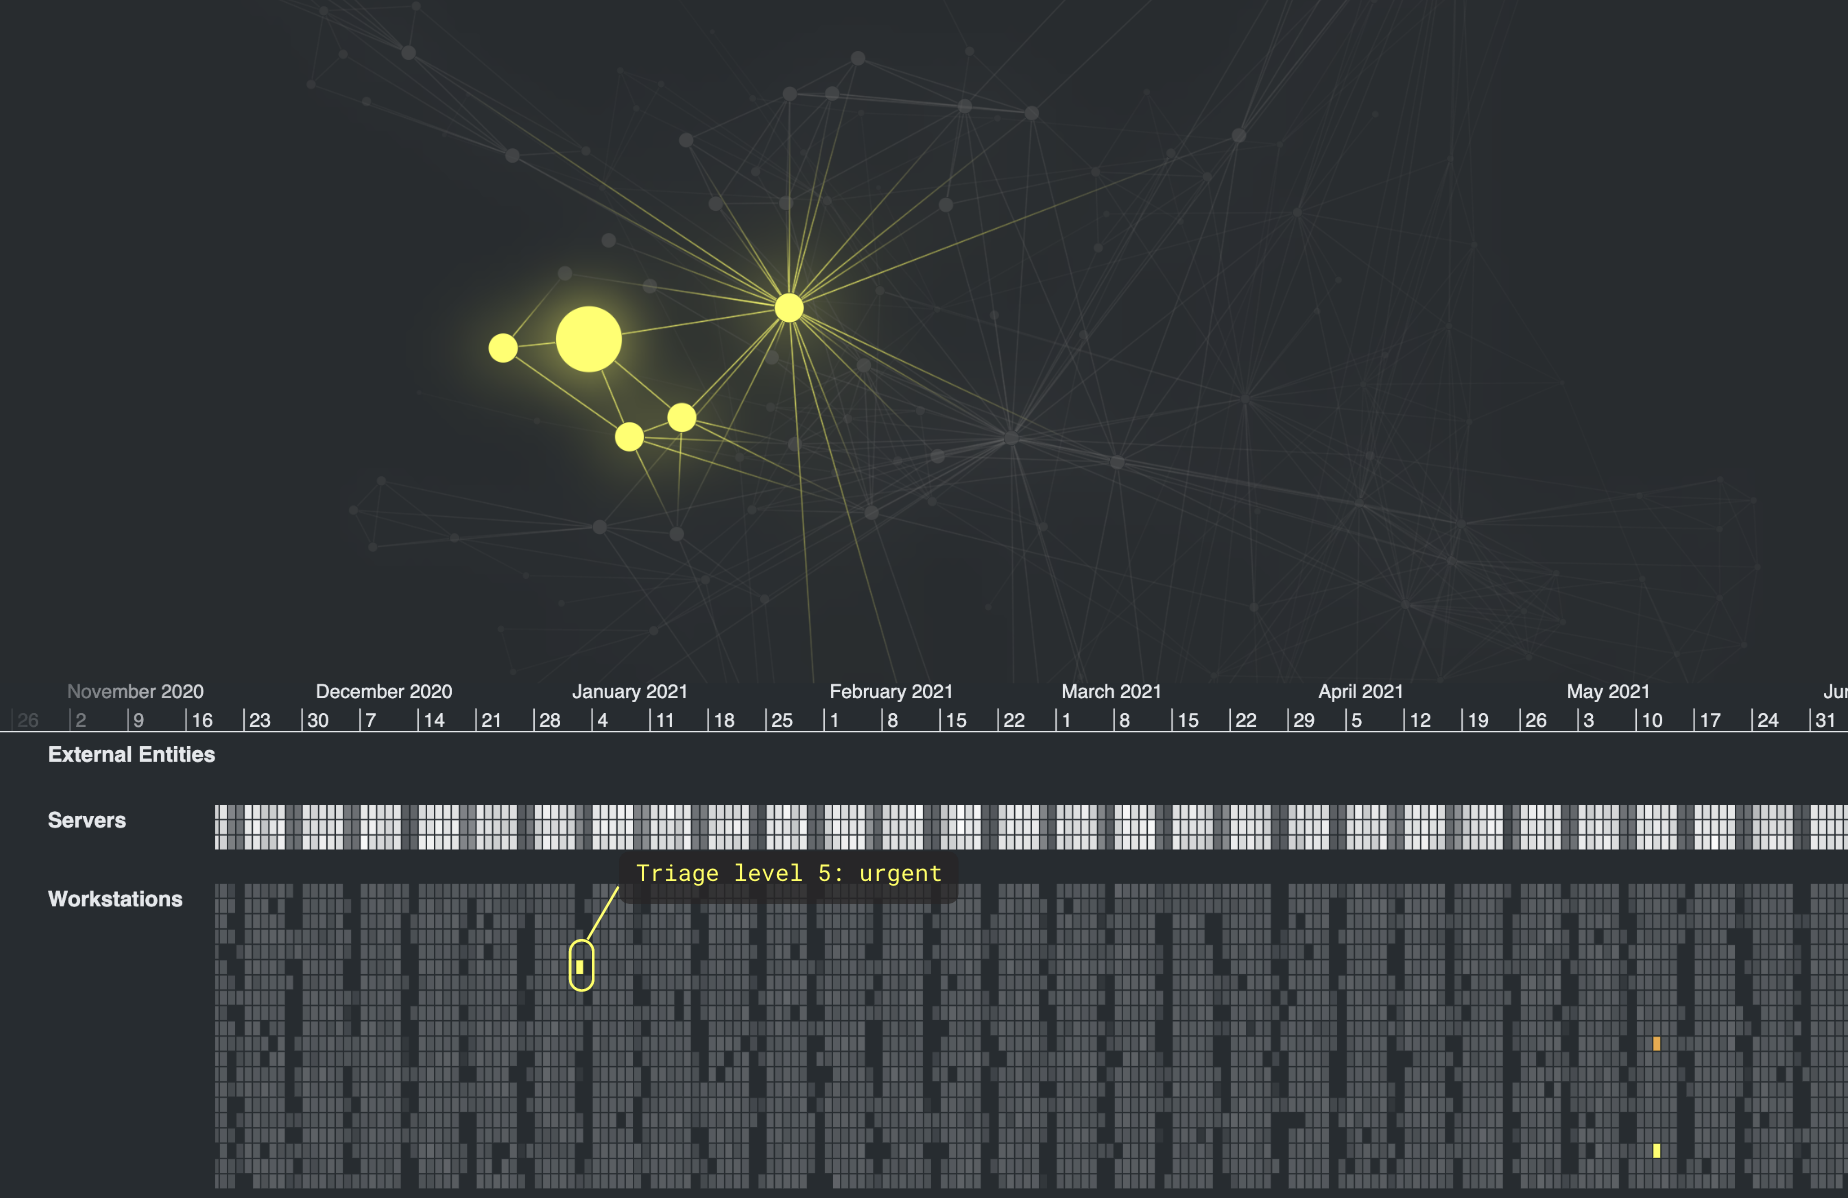
In domains like cyber security, analysts are overwhelmed by poorly prioritized or false alerts, making it difficult to focus on critical issues and too easy to ‘mute all’.
Contextualizing alerts with data visualization changes this dynamic. By visually representing an alert’s triage within its broader context - like a network topology map and a timeline of events - analysts see how alerts connect to surrounding systems and activities. This approach leads users to the most pressing problems and safely builds confidence in their systems.

Why include graph visualization in your AI-powered application
Graph visualization turns sprawling and intractable AI outputs into something a human can understand. AI insights brought to life with graph visualization make sense to users instantly, meaning analysts can take action fast.
Understand AI-driven insights
Interactive data visualization makes it easy for human analysts to interpret AI-driven recommendations, investigate their accuracy, explain them to others, and make business-critical decisions.
Validate black box recommendations
Many organizations use visualization to validate and understand the recommendations made by AI. Visualizing inputs and outputs makes black box systems more reliable, transparent and explainable.
Make faster, smarter decisions
AI tools are great at spotting or even predicting risk and threat. Data visualization gives analysts a rapid understanding of the context behind an alert, allowing them to make informed decisions on the next steps to take.
Build trust in your AI tool
Data visualization builds user confidence in your application by making complex AI processes transparent and easy to understand. It gives them an appreciation of the AI’s value and credibility.
GET STARTED
Sign-up to start a trial of our toolkits

Access our market-leading SDKs
Try the most powerful connected data visualization SDKs around.
Get expert support
You’ll enjoy the same great support as our customers.
Build prototypes, fast
Use our ready-made demos and coding playgrounds to accelerate your development.
4-MIN DEMO
What is graph visualization?
Graph visualization, sometimes also known as link analysis or network visualization, is an intuitive and powerful way to uncover connections and patterns in data.
The most effective way to visualize graphs is through a node-link model, where nodes represent entities and links represent connections.
These nodes and links can be anything – transactions between accounts, devices on a network, or phone calls between friends.
It doesn’t matter how large or small your data is, what it contains or where it’s stored. As long as there are connections you need to understand, you’ll find value in visualizing graphs. Watch our 4-min video to learn more.


