Graph visualization
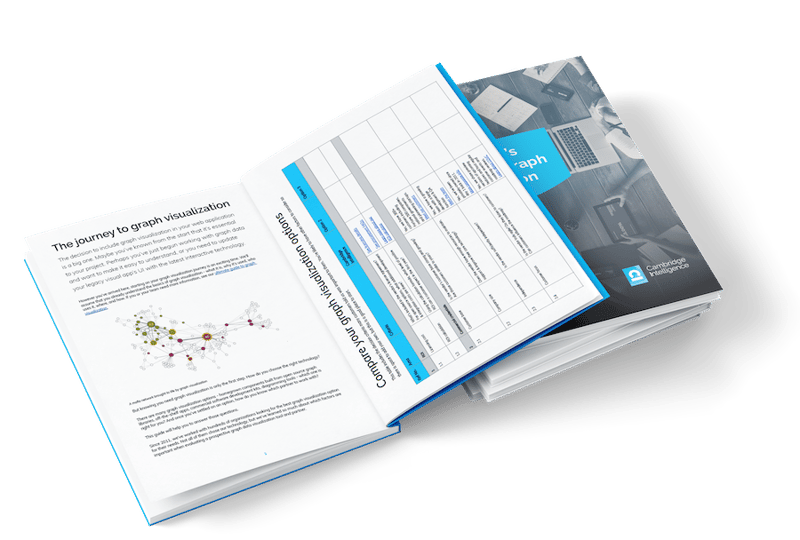
A buyer's guide & comparison template
A buyer's guide & comparison template
Starting on your graph visualization journey is an exciting time, but it can be overwhelming.
Open source code libraries, off-the-shelf apps, commercial SDKs, diagramming tools - how do you know which is right for you? Our Buyer's Guide and comparison template will help.
In this buyer's guide and comparison template, we share the decision criteria our customers told us were their top priorities. They're grouped into six categories:
The guide also includes a handy checklist so you can compare technology partners more easily.
This white paper is for every stakeholder responsible for delivering a successful graph visualization project. That includes:
"There is a growing market for visual tools that make big data accessible and simplify complexity. Cambridge Intelligence has the best technology to do that. Our partnership means we can consistently deliver outstanding software and expertise, keeping our customers happy and creating innovative solutions to their challenges.
Sistemi & Automazione
Hundreds of teams rely on our toolkits and cutting-edge innovation to power complex data user experiences in their products and applications.


