Connected Insights Cambridge
16 + 17 October 2024
16 + 17 October 2024
Join us in our hometown for two days of learning and insights.
You'll hear directly from the expert team behind the Cambridge Intelligence toolkits, and learn from other trailblazing data visualization practitioners as we share experience and advice.
Thanks to everyone who joined us for this event!


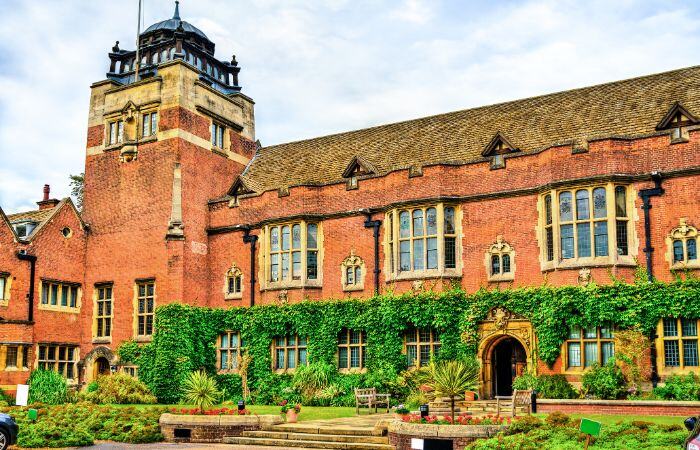
We'll meet at the Woolf Institute, part of Westminster College, just on the edge of the picturesque Cambridge Backs.
Wednesday 16 October - 9.30am to 4.30pm - is a technical training session for coders, led by Cambridge Intelligence developers. The morning will have sessions covering visualization techniques and core graph features in dealing with large data sets, with the afternoon set aside for a collaborative hackathon exercise.
Thursday 17 October - 9.30am to 4.30pm - is a day of conversations and presentations, covering all aspects of the future of connected data visualization. Expect use case demos from customers, new prototypes from our development team and plenty of guidance best practice tips from the wider team.
Technical training session
| 9.30 - 10.00 | Arrival, coffee and pastries |
| 10.00 - 10.15 | Welcome and introductions |
| 10.15 - 11.00 | Training setup and workshop 1 |
| 11.00 - 11.20 | Morning coffee break |
| 11.20 - 13.00 | Workshop 2 |
| 13.00 - 14.00 | Lunch & networking |
| 14.00 - 15.00 | Hackathon |
| 15.00 - 15.30 | Afternoon coffee break |
| 15.30 - 16.00 | Hackathon |
| 16.00 - 16.25 | Team presentations |
| 16.25 - 16.30 | Training wrap-up |
| Evening | Connected Insights dinner at a central venue. |
Connected Insights meeting
| 9.30 - 10.00 | Arrival, coffee and pastries |
| 10.00 - 10.25 | Welcome, introductions and the agenda |
| 10.25 - 11.00 | Product update - what's new and planned? |
| 11.00 - 11.20 | Morning coffee break |
| 11.20 - 12.15 | Technical session - geospatial visualization |
| 12.15 - 12.30 | Guest presentation |
| 12.30 - 13.00 | Feature requests and your feedback |
| 13.00 - 14.00 | Lunch & networking |
| 14.00 - 14.15 | Guest presentation |
| 14.15 - 15.00 | Technical session - time-dependent data |
| 15.00 - 15.30 | Afternoon coffee break |
| 15.30 - 16.20 | Data visualization tips & tricks |
| 16.20 - 16.30 | Meeting wrap-up |
| 16.30 onwards | Drinks reception at a nearby pub |
Join day one for a free workshop, led by technical experts, open exclusively to developers using the KeyLines, ReGraph and KronoGraph toolkits.
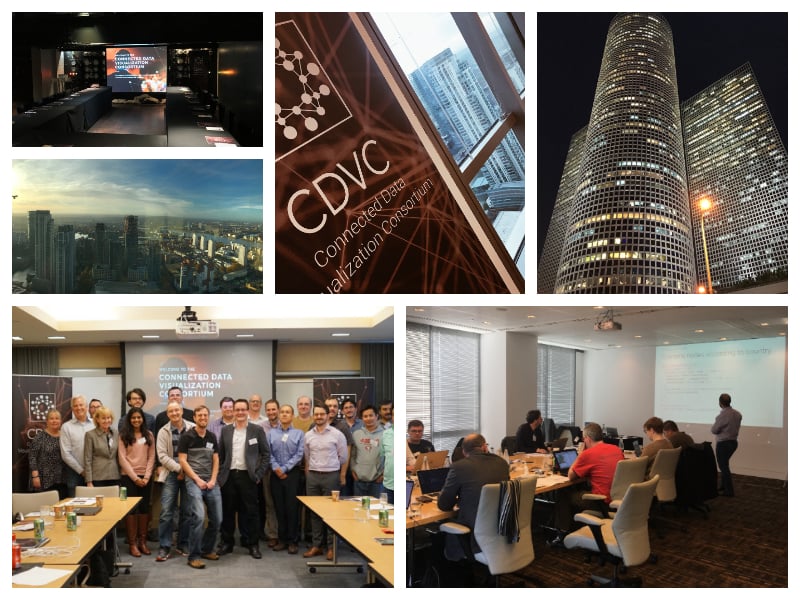
Take time to meet and share experiences with other connected data visualization practitioners from all over Europe.
Get sneak previews of upcoming features and visualization techniques, and share your views on the future of Connected data visualization.
Westminster College is just on the northern edge of Cambridge city center. You can get there quickly on foot (or cycle!) from a central hotel, or with a 10-minute taxi ride from Cambridge railway station.
If you're coming from overseas, London Stansted is the closest airport to Cambridge, with multiple direct trains each hour.
The following hotels are all within walking distance of our venue:
Venue address: Woolf Institute, Westminster College, Madingley Road, Cambridge, CB3 0UB
What3Words: shaky.bounty.tiny

Our connected Insights sessions bring together organizations using the Cambridge Intelligence suite of connected data visualization toolkits. They're a great opportunity to:
Attendance is limited, to help ensure everyone can have their voice heard in the conversation.
At a Connected Insights session, we aim to push the boundaries of connected data visualization, pooling expertise and experience to make advances in three key areas:
Designing experiences to help users make visual analysis part of their daily routine.
| Design effective workflows |
| Facilitate collaboration |
| Get user uptake |
| Encourage interactivity |
How to make the right data available, to the right people at the right time.
| Sources of graph data |
| Data federation and enrichment |
| Managing hairball datasets |
| Reducing chart clutter |
What will the next generation of data visualization applications look like?
| Sources of graph data |
| Data federation and enrichment |
| Managing hairball datasets |
| Create a vision of the future |