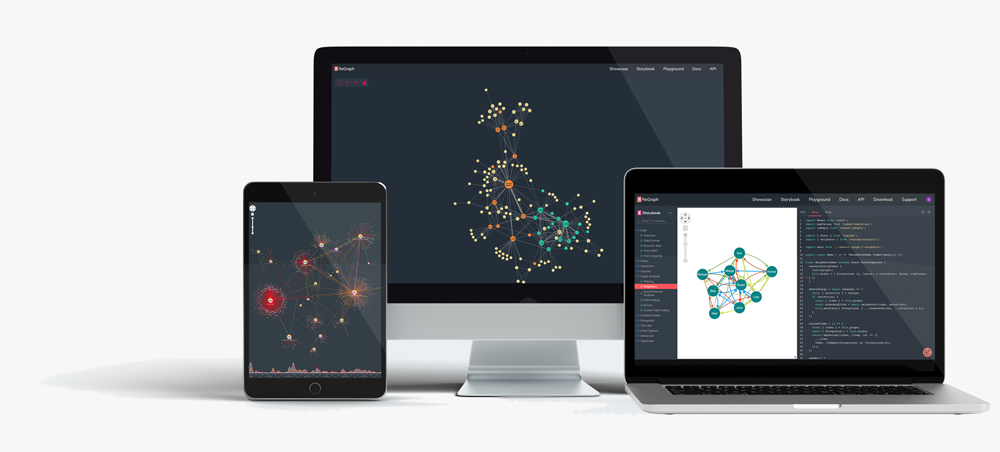
Your fast-track to graph database visualization success
Transform complex graph data into insight
Transform complex graph data into insight
Lightweight, scalable and powerful graph database visualization applications
Discover a completely flexible way to build your graph visualization application.
Our software development toolkits offer a number of integrations, covering all of the most popular graph databases including Neo4J, AWS Neptune, Azure Cosmos DB, or ArangoDB.
Learn everything you need to build effective graph visualizations in our white paper.


Our toolkits make it easy to build powerful graph database visualization applications. Everything has been carefully optimized for performance, from their layout algorithms to their supercharged graphics rendering engine.

Graph visualization software works best when shared. Applications built with our graph database visualization toolkits are powered by modern web technologies and can be easily rolled into other tools and deployed to anyone, wherever they are.

Every aspect of your application can be tailored to suit your users, their data and the questions they need to answer. The result is a custom graph database visualization tool that’s easy to use, looks great and integrates seamlessly.
Connected data visualization plays a mission-critical role in all kinds of use cases and many different industries, helping analysts and investigators to understand risk and manage threats.
“Combining KeyLines with Neo4j was a great decision. It’s enabled us to build on the power of Cypher queries, so users can perform advanced searches and graph analysis with an intuitive KeyLines interface. Compared with all the other options, KeyLines was simpler, faster and resulted in a higher-quality product.”
Petra Kaul, Kantwert
Applications built with our toolkits offer unrivaled graph database analysis functionality for deep insight.
We make it easy for developers to include advanced graph algorithms, filtering, map and time-based analysis in their most intuitive graph visualization apps.

The fastest way to tame a noisy dataset is by filtering out the information and focusing on what you need to understand. Create filters based on any data attribute or logic you need.

Aliases, known associates, connected accounts: sometimes data gets messy. Our combos feature tidies away that complexity, ready for investigators and analysts to explore at their own pace.

Need to find the most connected node? Or the account at the core of a money laundering scheme? Graph analytics are powerful analysis algorithms that reveal insights you’d spend days uncovering.

Every event happens at a point or duration in time. Our tech makes it easy to filter on periods of interest, see when events occur and observe evolving patterns.

Hairball networks are no help to anyone. But powerful layout algorithms add clarity and reveal the underlying patterns and connections you might otherwise miss.

We’ve pioneered new ways to visualize complex data since 2011.
Hundreds of teams rely on our toolkits and cutting-edge innovation to power complex data user experiences in their products and applications.
Join forces with our skilled experts to deliver insightful visualization tools that inspire your users.

Build your big ideas on the foundation of our data visualization expertise. It’s our special subject.
We’ve partnered with leading organizations in cybersecurity, intelligence and fraud detection for years. We understand your data visualization challenges, and how to overcome them.
And we’re here for the long haul to help your projects evolve, improve and succeed.

Developers around the world love our toolkits.
They set the standard, with elegant APIs, user-friendly docs and quick-start examples to save you coding from scratch. Need technical support? The team that built the toolkits is on hand to help.
You get everything you need to build complex data visualization apps, fast.

We build toolkits for performance and scale, and have the metrics to prove it.
Their unrivaled functionality and unlimited customization options provide a beautiful visualization experience, 100% tailored to your users’ needs.

Everything you need to start building effective graph visualizations that'll help your users find insight in connected data fast.