The leading graph visualization SDKs
Your fast-track to graph visualization success

“We chose Cambridge Intelligence because their products provided the level of support and documentation we needed. It also has the best performance and the right combination of features to provide that intuitive access to data our users needed.”
Huw Edmunds, Solution Architect, Microsoft Services


Prototype your graph visualization in minutes
WHITE PAPER
The ultimate guide to graph visualization

Our white paper dives into the details of graph visualization, including best practices, use cases and visual analysis techniques.
It's the ideal starting point for anyone interested in building effective and scalable graph visualization applications.
Why graph visualization?
The world is complex. With powerful graph visualization, you can make sense of it by uncovering insight that reveals threats, risks and opportunities.
It’s intuitive
Get an immediate clear understanding of complex data relationships.
It’s holistic
Connect data points from multiple and diverse sources.
It’s fast
Accelerate the process of identifying trends, outliers and clusters.
It’s scalable
Reveal the wider context, structure and relationships within data.
Graph visualization use cases
Graph visualization is a mission-critical tool in all kinds of use cases and many different industries. Some important use cases include:
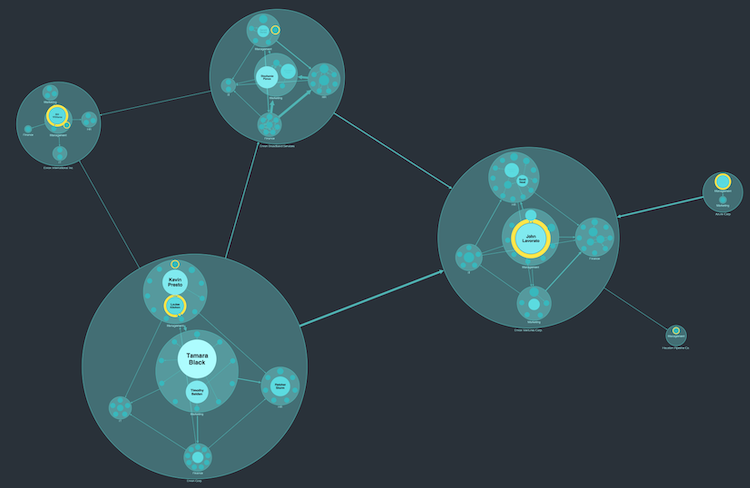
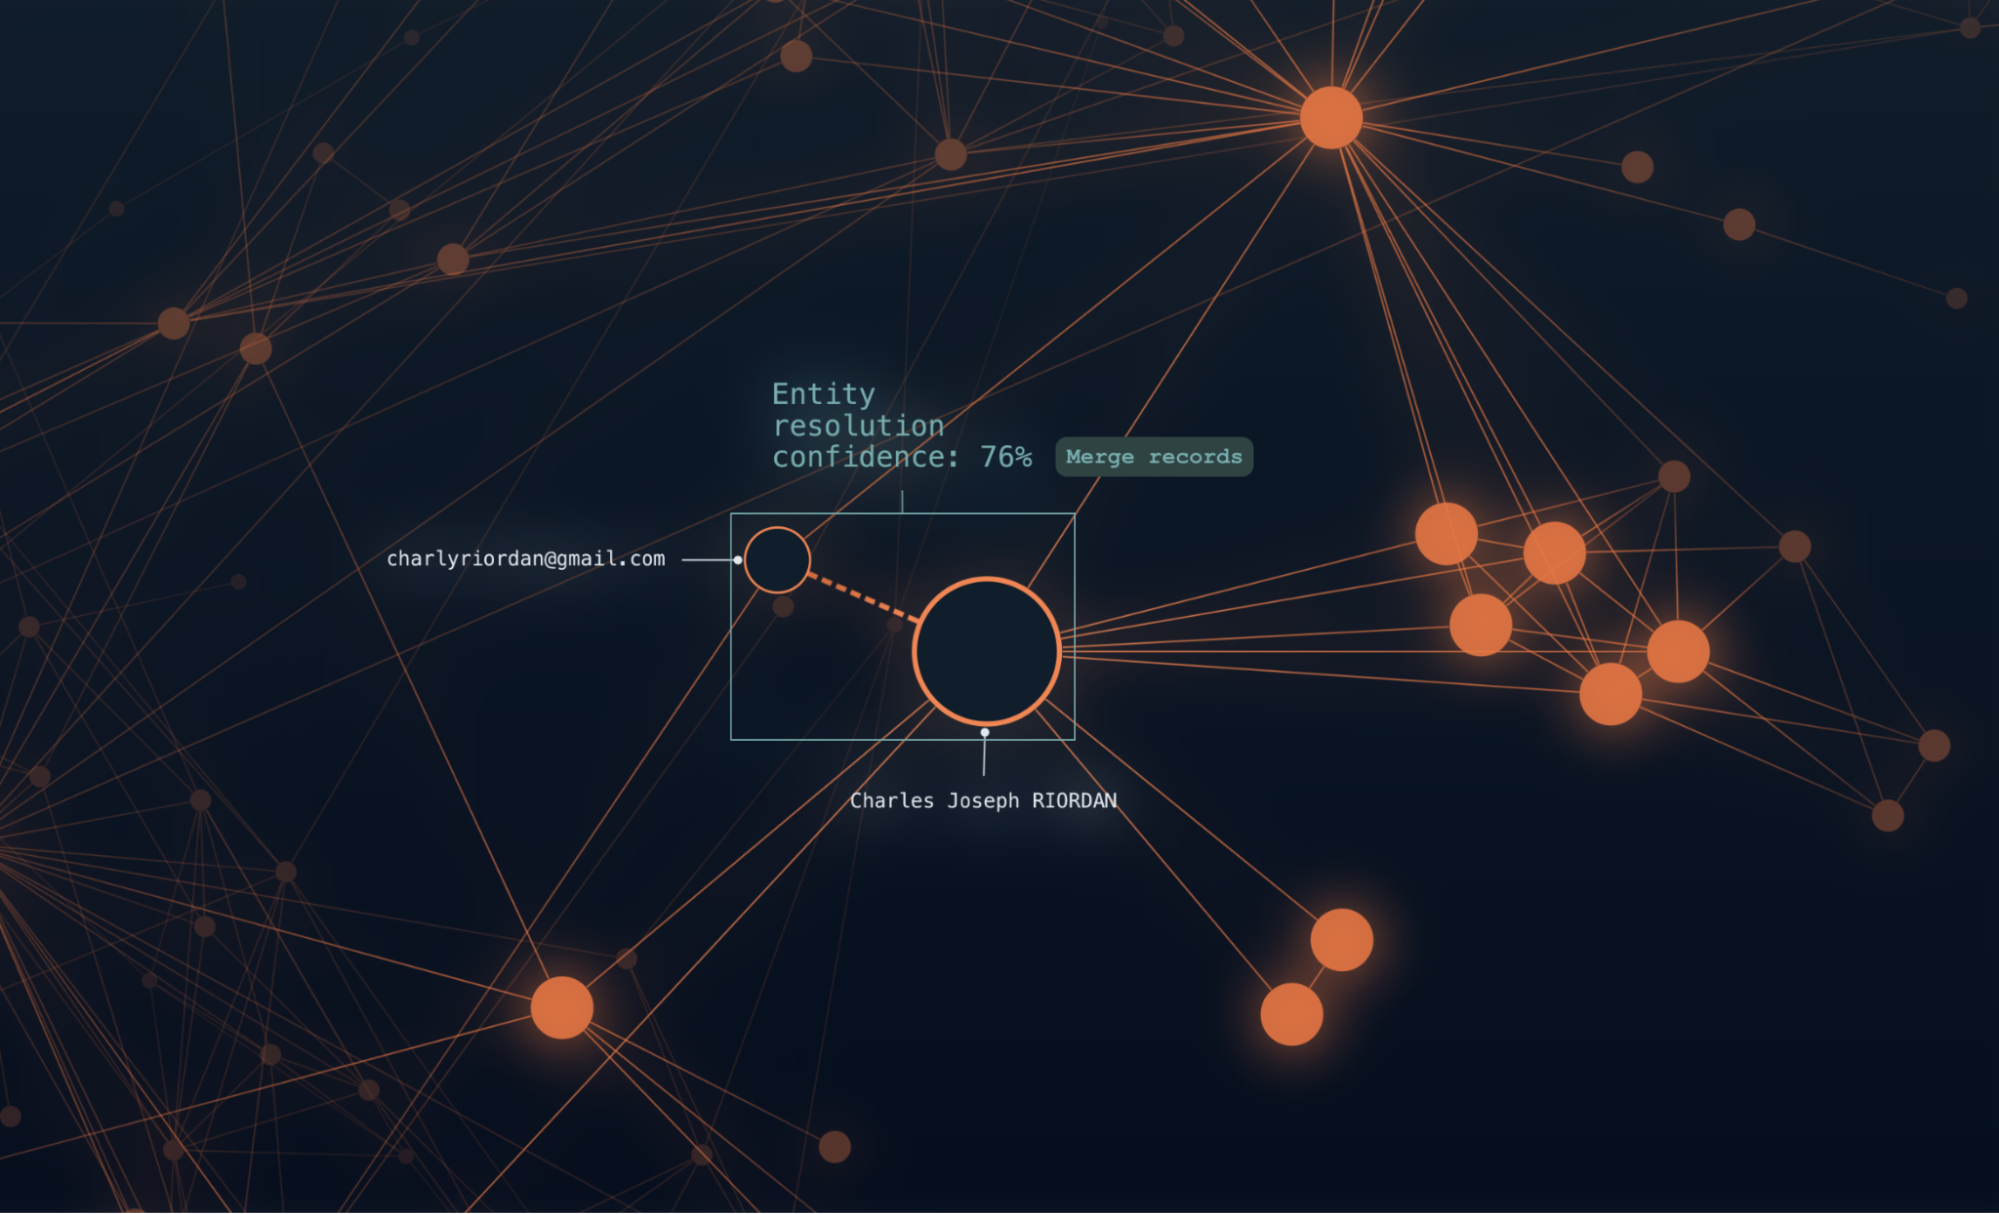
Intelligence & Law enforcement
Graph visualization plays a vital role throughout the intelligence cycle, from collection and analysis to dissemination.
It helps investigators explore communication records for lawful interception, turn open source data into valuable open source intelligence (OSINT) and generally ensure joined-up, effective investigations.
By visualizing critical links, graph visualizations powers efficient analysis and clear insight dissemination, so officers and analysts can make faster, more informed decisions.
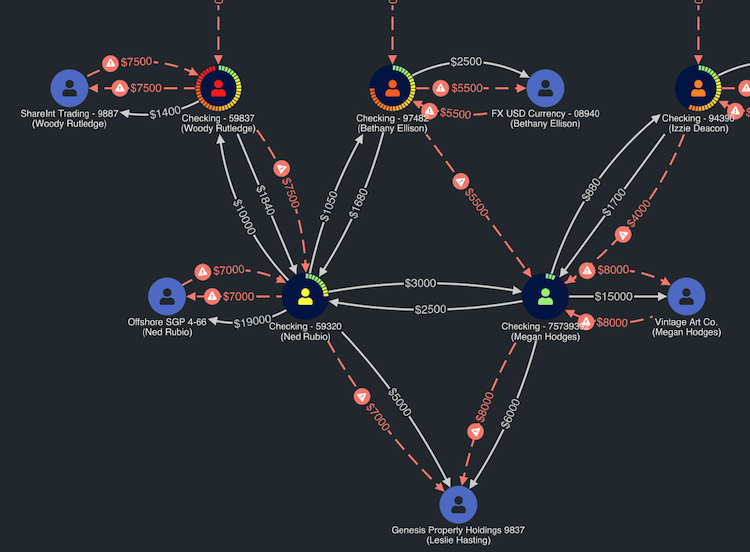
Financial Crime
In financial crime management, graph visualization turns complex data into actionable insights.
By mapping relationships across transactions and entities, graph visualization helps risk teams identify fraud, prevent money laundering and stop illicit activities.
Effective graph visualization streamlines routine checks and enhances investigations into complex, high-risk cases. By revealing suspicious patterns and connections between individuals or organizations, teams can better detect risks, investigate threats and ensure regulatory compliance.
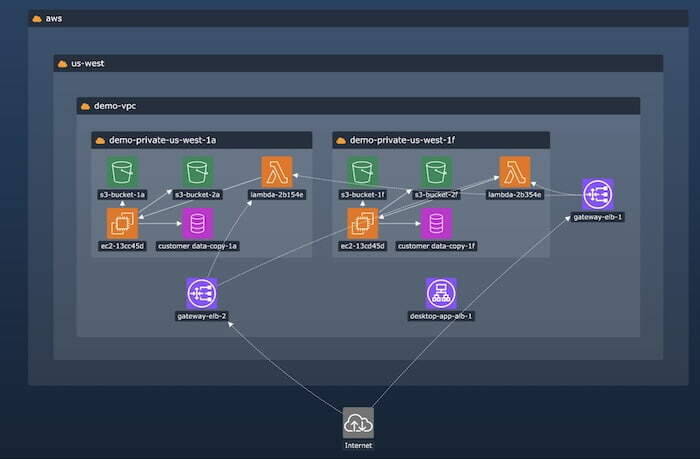
Cyber Security
Graph visualization is a powerful tool in cloud and cyber security, helping teams understand cyber threats, map complex network topologies and protect their attack surfaces.
By visualizing connections between devices, users, systems and threats, it uncovers vulnerabilities and inefficiencies, aiding proactive threat detection, response and prevention cycles.
In short, graphs help security teams see and understand cyber threats, assess their risk exposure and mitigate potential breaches quickly.
GET STARTED
Sign-up to start a trial of our toolkits

Access our market-leading SDKs
Try the most powerful connected data visualization SDKs around.
Get expert support
You’ll enjoy the same great support as our customers.
Build prototypes, fast
Use our ready-made demos and coding playgrounds to accelerate your development.
Real-world data is complicated. Visualizing it shouldn’t be.
Our developer toolkits make it easy to build powerful, customized user experiences for complex data. Alongside our expert guidance and technical support, you’ll have your graph visualization application ready in weeks, not months.
Easy integration, accelerated delivery and great graph visualization is here, for startups and tech giants alike.
Complex data visualization. It’s in our DNA.
We’ve pioneered new ways to visualize complex data since 2011.
Hundreds of teams rely on our toolkits and cutting-edge innovation to power complex data user experiences in their products and applications.
Join forces with our skilled experts to deliver insightful graph visualization tools that inspire your users.

We’ve helped teams just like yours
Build your big ideas on the foundation of our graph visualization expertise. It’s our special subject.
We’ve partnered with leading organizations in cybersecurity, intelligence and fraud detection for years. We understand your data visualization challenges, and how to overcome them.
And we’re here for the long haul to help your projects evolve, improve and succeed.
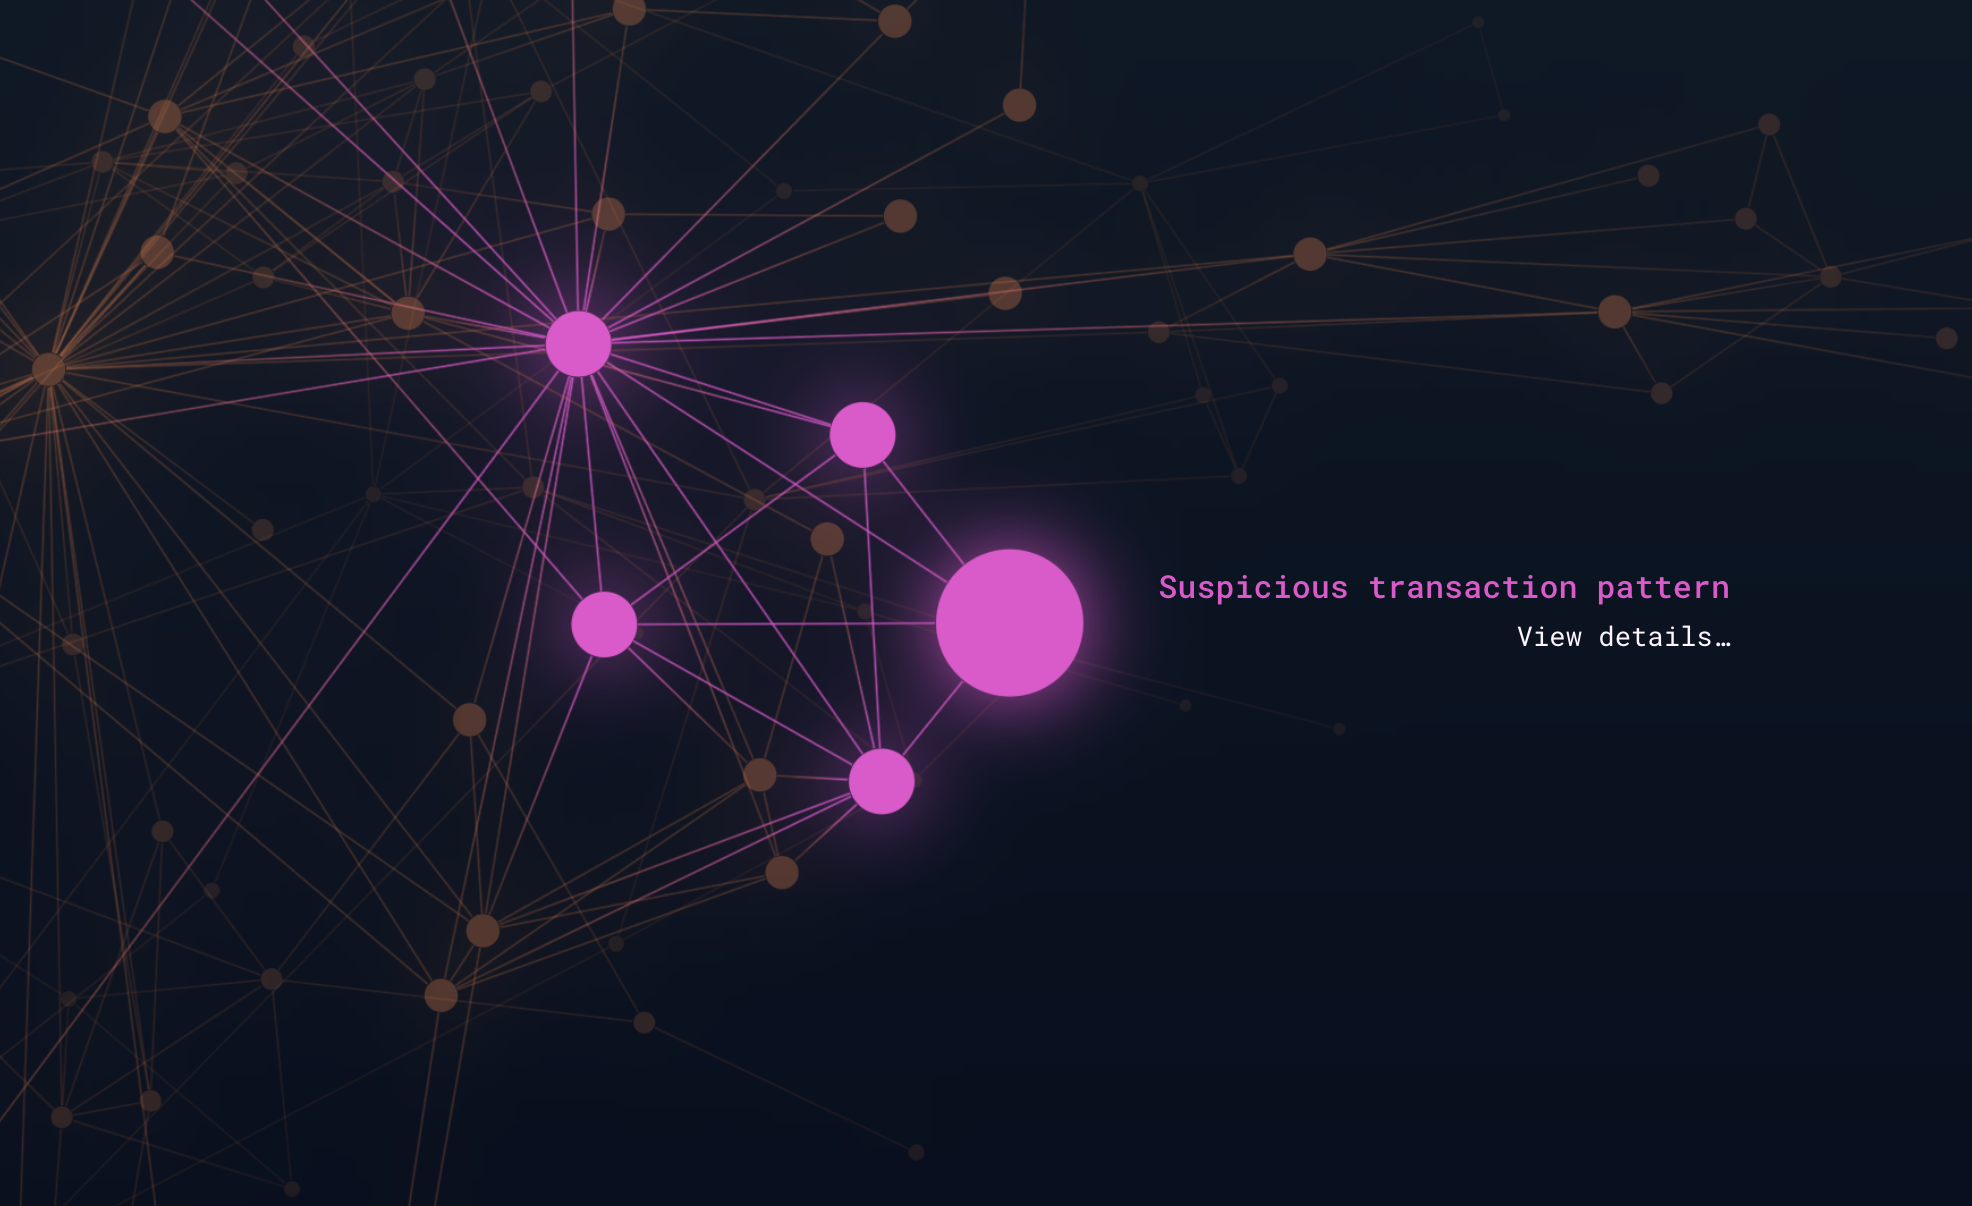
Sleek, modern DevEx
Developers around the world love our toolkits.
They set the standard, with elegant APIs, user-friendly docs and quick-start examples to save you coding from scratch.
Need technical support? The team that built the toolkits is on hand to help.
You get everything you need to build complex graph data visualization apps, fast.
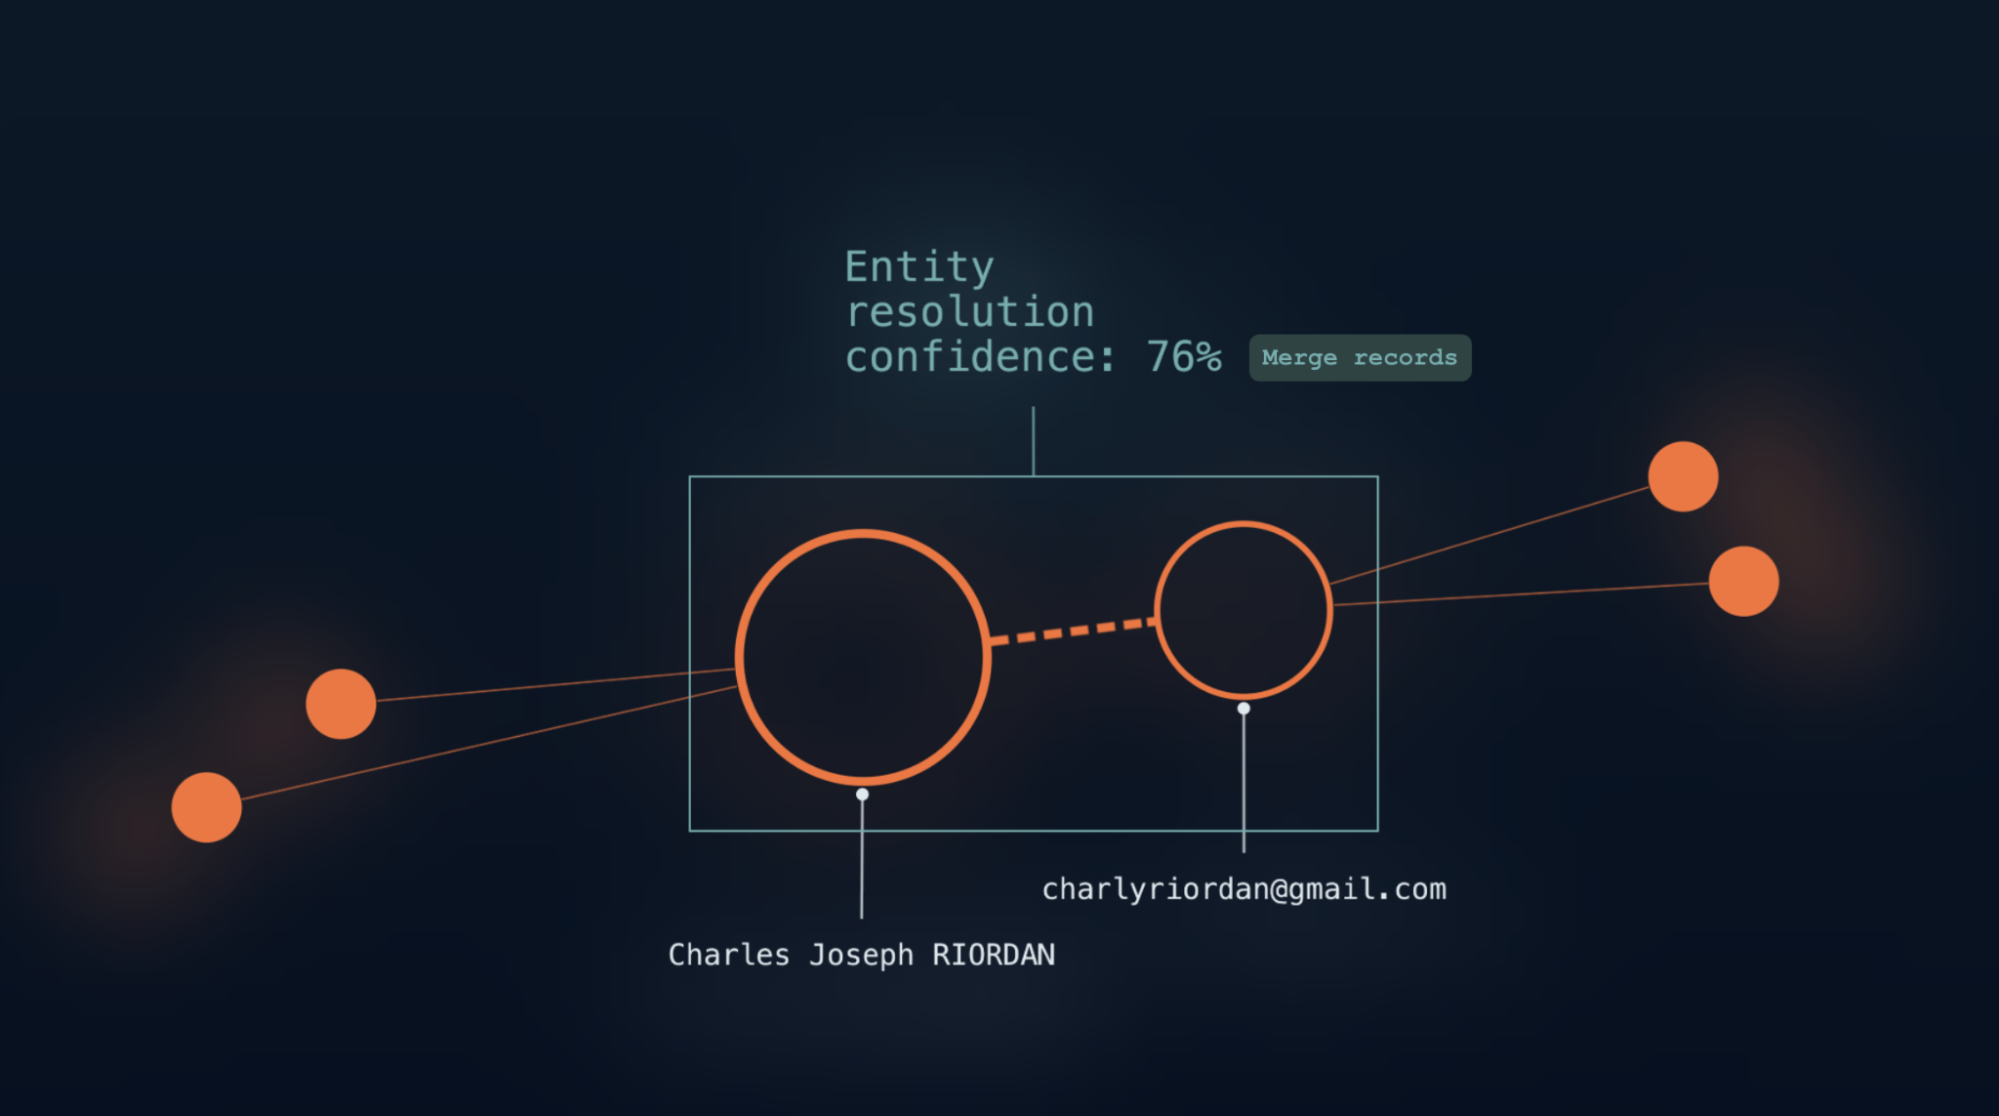
Performance, scale, functionality AND flexibility
We build toolkits for performance and scale, and have the metrics to prove it.
Their unrivaled functionality and unlimited customization options provide a beautiful visualization experience, 100% tailored to your users’ needs.
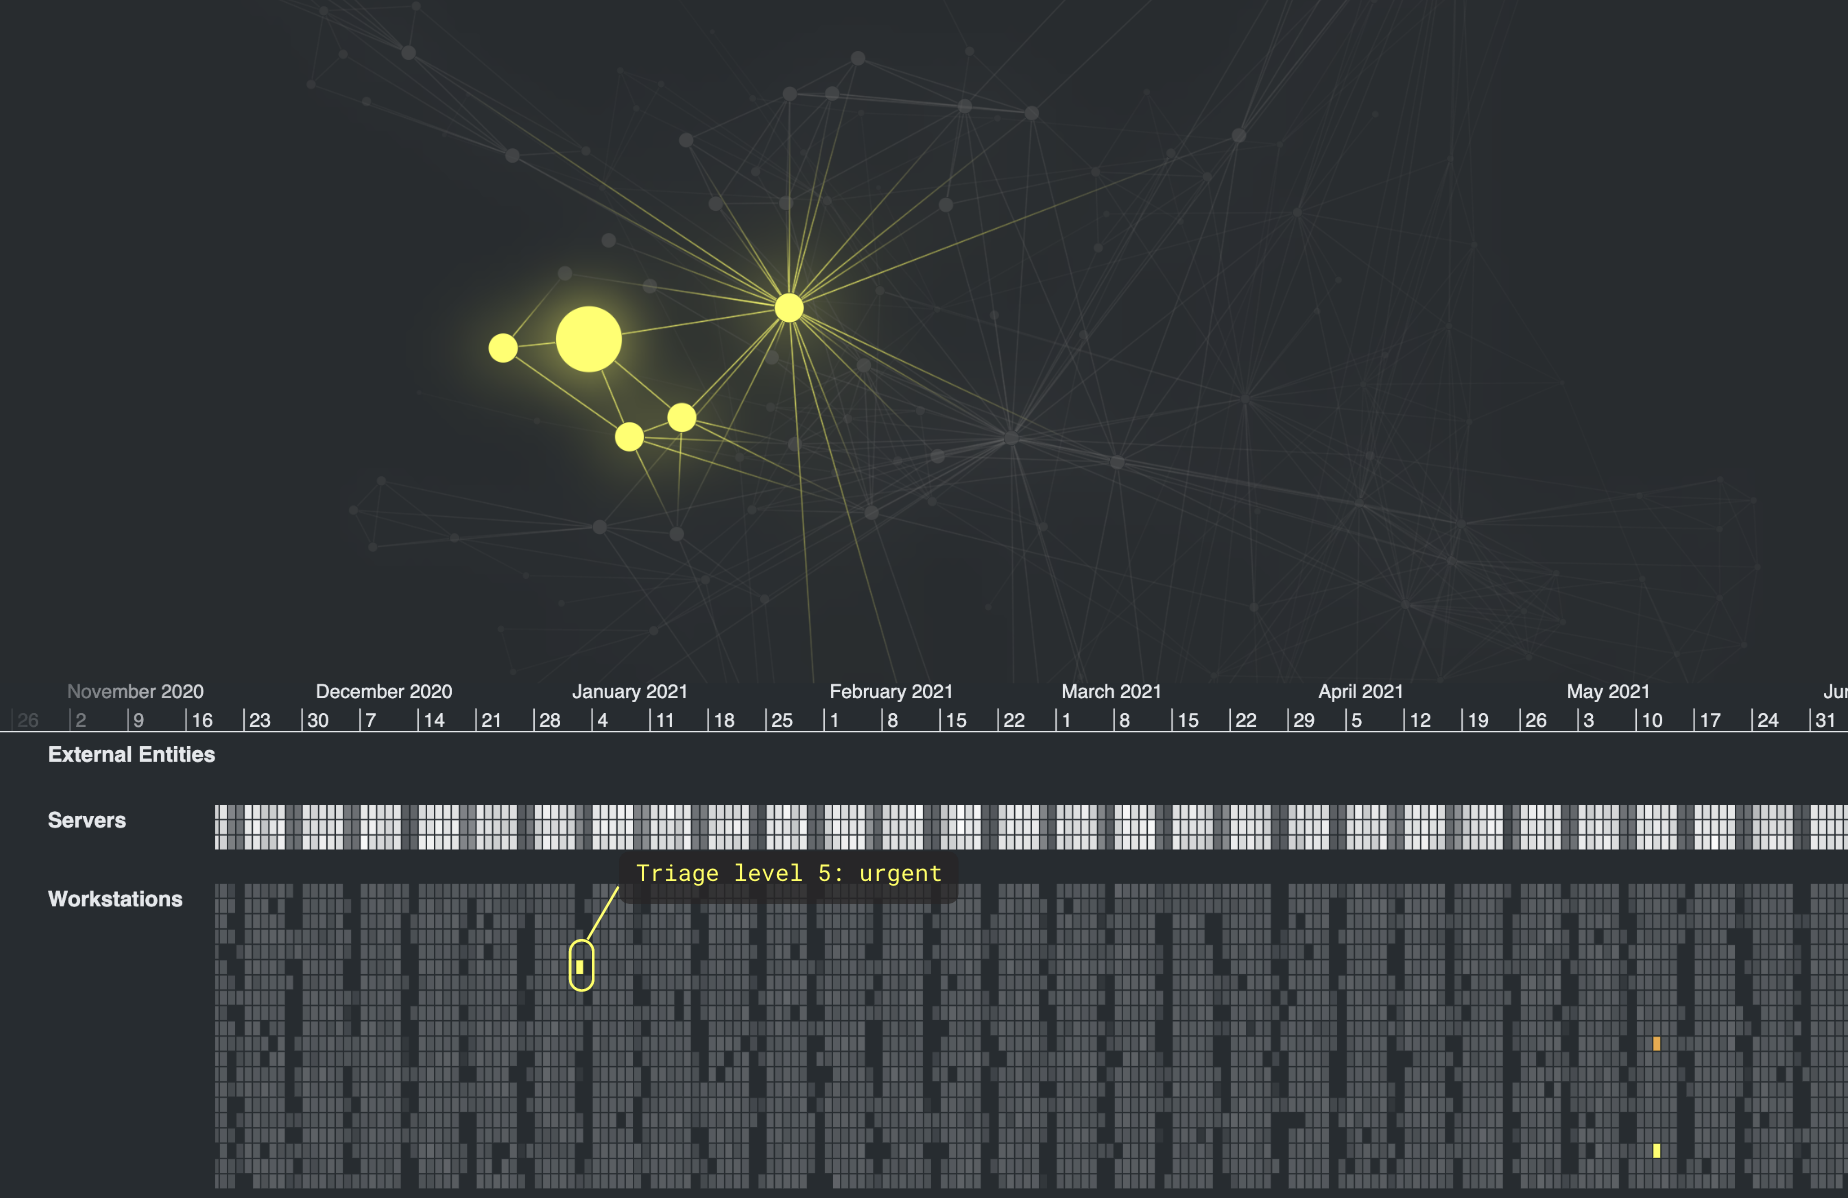
4-MIN DEMO
What is graph visualization?
Graph visualization, sometimes also known as link analysis or network visualization, is an intuitive and powerful way to uncover connections and patterns in data.
The most effective way to visualize graphs is through a node-link model, where nodes represent entities and links represent connections.
These nodes and links can be anything – transactions between accounts, devices on a network, or phone calls between friends.
It doesn’t matter how large or small your data is, what it contains or where it’s stored. As long as there are connections you need to understand, you’ll find value in visualizing graphs. Watch our 4-min video to learn more.


