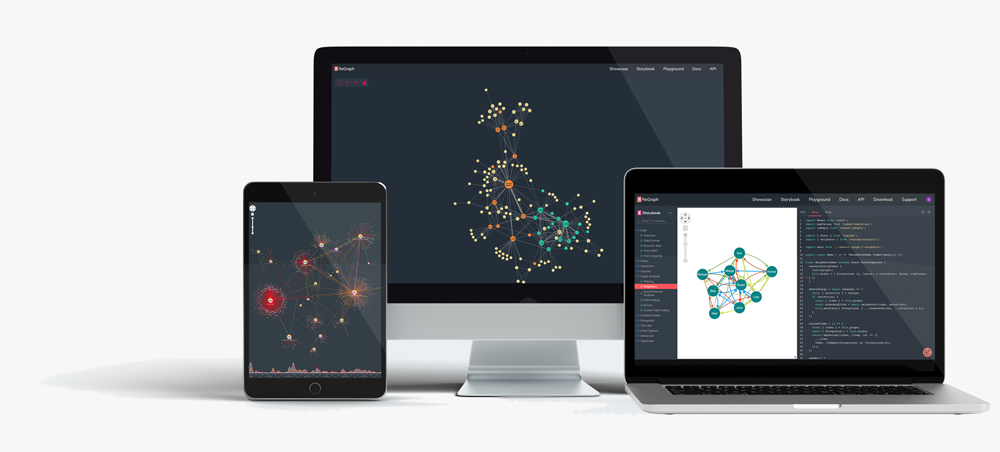
Your fast-track to link analysis success
The world's leading link analysis SDKs
The world's leading link analysis SDKs
Build game-changing link analysis products that turn connected data into insight.
Using our software development toolkits, it’s quick and easy to build powerful link analysis applications, roll them into analysts’ tools and workflows, and deploy them anywhere in the world.
How visualizing your data with our link analysis tools
will help you understand connected data.
Our JavaScript toolkits will get your link analysis projects to production quickly and easily.
They’re built with a developer’s needs in mind: a seamless integration with your environment, fully-documented APIs with powerful demos, and a great user experience so that tools feel familiar right away.
Integrating KeyLines (JavaScript) or ReGraph (React) with our KronoGraph SDK supercharges your browser-based link analysis application with unique, time-based visualizations.

"We knew we wanted to offer a more contextual view to the fraud data we hold. The most effective way of doing this was by incorporating a second level of data linkage – not just showing the direct ‘hits’, but also the connections from those hits to other entities.
We just needed to find a way of communicating all that data in a single easy to digest report. As soon as I saw KeyLines, I knew it was the solution we needed."
Simon Fitzgerald, Data Sharing Services Manager, CIFAS
Real-world data is complex and densely connected. Often, to answer important questions, you need to understand those connections.
That's where link analysis comes into its own.

Link analysis breaks down silos between data sources, pulling an entire analysis workflow into a single, intuitive view, ready for analysts to explore at their own pace.

Real-world graph data is big and complex. Link analysis simplifies that complexity, but also reveals context and detail that analysts need to understand.

The node-link graph model is intuitive and clear. It instantly makes sense, even to people who’ve never worked with graphs before.

Our brains are great at spotting patterns, but only when they’re presented in a tangible format. Our data visualizations help you identify trends and outliers quickly.
Applications built with our toolkits offer unrivaled link analysis functionality for deep insight.
We make it easy for developers to include advanced graph algorithms, filtering, map and time-based analysis in their most intuitive link analysis apps.

The fastest way to tame a noisy dataset is by filtering out the information and focusing on what you need to understand. Create filters based on any data attribute or logic you need.

Aliases, known associates, connected accounts: sometimes data gets messy. Our combos feature tidies away that complexity, ready for investigators and analysts to explore at their own pace.

Need to find the most connected node? Or the account at the core of a money laundering scheme? Graph analytics are powerful analysis algorithms that reveal insights you’d spend days uncovering.

Every event happens at a point or duration in time. Our tech makes it easy to filter on periods of interest, see when events occur and observe evolving patterns.

Hairball networks are no help to anyone. But powerful layout algorithms add clarity and reveal the underlying patterns and connections you might otherwise miss.
Our toolkits can be used for any use case. If your data contains connections you need to understand, we can help you visualize it.

Map call data records and pattern of life information to reveal clear sequences of events.

Analyze financial transactions and communications to uncover fraud and insider trading.

Examine complex network incidents to understand threat activity and reveal vulnerabilities.
From governments and global leaders, to fast-growing start-ups, we’ve built close relationships with hundreds of customers worldwide.


We’ve pioneered new ways to visualize complex data since 2011.
Hundreds of teams rely on our toolkits and cutting-edge innovation to power complex data user experiences in their products and applications.
Join forces with our skilled experts to deliver insightful visualization tools that inspire your users.

Build your big ideas on the foundation of our data visualization expertise. It’s our special subject.
We’ve partnered with leading organizations in cybersecurity, intelligence and fraud detection for years. We understand your data visualization challenges, and how to overcome them.
And we’re here for the long haul to help your projects evolve, improve and succeed.

Developers around the world love our toolkits.
They set the standard, with elegant APIs, user-friendly docs and quick-start examples to save you coding from scratch. Need technical support? The team that built the toolkits is on hand to help.
You get everything you need to build complex data visualization apps, fast.

We build toolkits for performance and scale, and have the metrics to prove it.
Their unrivaled functionality and unlimited customization options provide a beautiful visualization experience, 100% tailored to your users’ needs.