The React library for advanced graph visualization
Designed for React developers
Designed for React developers
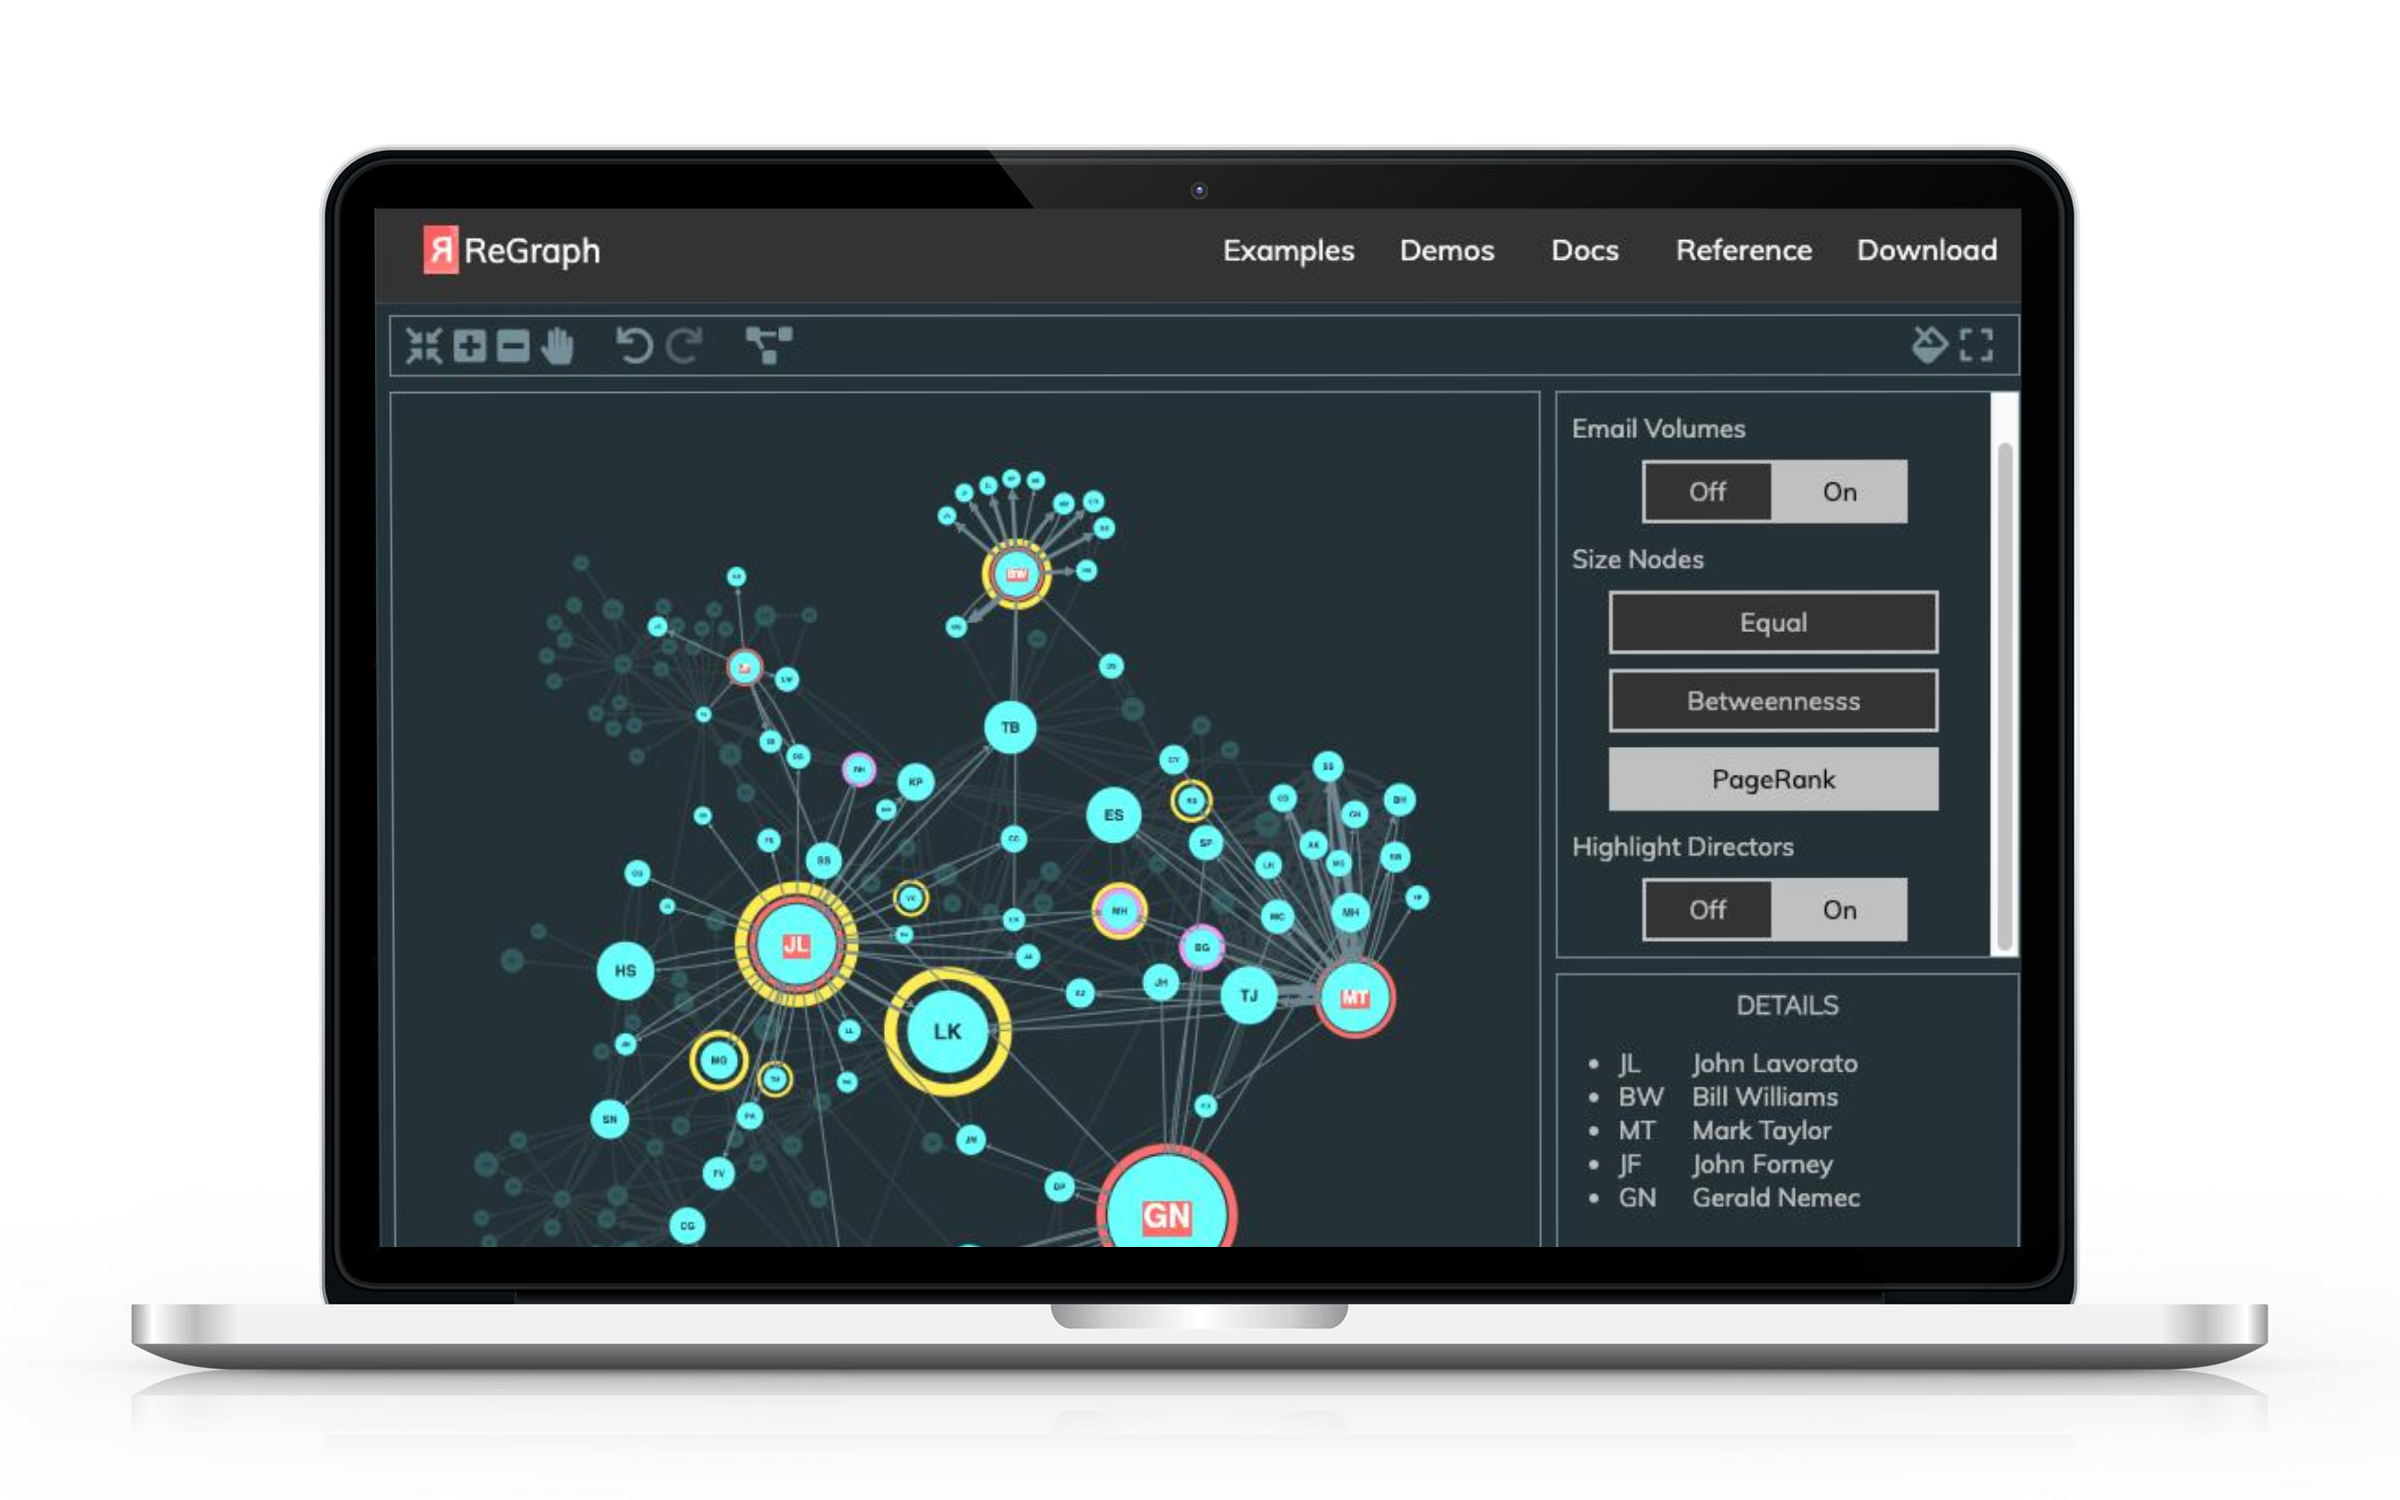
Create interactive graph visualization components, optimized for performance.

With ReGraph’s simple data-driven API, it’s quick and easy to add graph visualizations to your React apps.

For React developers, ReGraph offers a simple and clean coding experience. It has familiar logic, easy state handling and well-documented props.
You can choose where your data is stored, and how the component looks and behaves. It works in any browser, on any device, and integrates readily with any server or database.
It’s a completely flexible way to build a custom React graph visualization application.
"Our developers love the toolkits. They’ve found them to be really reliable and powerful. The SDKs are well documented and informative, with great functionality that our users are going to find invaluable."
Josh Przybylko, Director of Product Management at C3 AI
Code the React way, with component-based state management,
JSX-coded elements with clear syntax and a data-driven, declarative API.
If you’re a developer looking for a React graph visualization toolkit, ReGraph is designed for you.

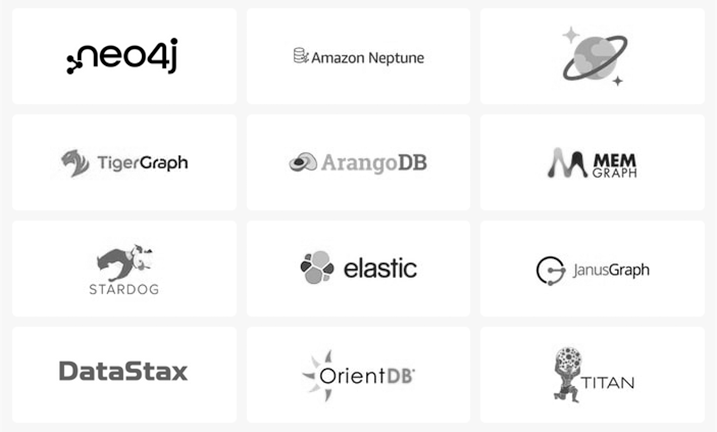
ReGraph works with virtually any database. If your data can be parsed into JSON format, ReGraph can visualize it.
Like other React components, ReGraph sits in the front end of your application – completely separate from the back end. Data is passed as a plain JavaScript object: it’s up to you how to deliver data to the client.


ReGraph comes loaded with high-performance features to analyze your biggest datasets.
ReGraph components allow you to visualize time-based and geospatial data, while advanced layouts and graph analysis functions help you make sense of it.

ReGraph’s carefully-crafted API, tutorials, demos and interactive Playground coding environment make prototyping fast and effective.

ReGraph is fully browser-based and has minimal dependencies. The result: it’s easy to deploy to all your users, wherever they are.

The React developers who built the toolkit offer expert guidance. They’re ready to help with fast responses to technical queries.

"Integrating ReGraph into our intelligence platform took little effort. The added value of the graph and time bar visualization, on the other hand, is massive. Our customers love the additional possibilities, as they now have new views that improve their decision-making process."
Dirk Kolb, CEO and Founder of Traversals
An in-depth overview of graph visualization and ReGraph, including the features, benefits and use cases.
In this white paper you’ll find real-word use cases for graph visualization, as well as details of what ReGraph has to offer to developers and end users.


We’ve pioneered new ways to visualize complex data since 2011.
Hundreds of teams rely on our toolkits and cutting-edge innovation to power complex data user experiences in their products and applications.
Join forces with our skilled experts to deliver insightful visualization tools that inspire your users.

Build your big ideas on the foundation of our data visualization expertise. It’s our special subject.
We’ve partnered with leading organizations in cybersecurity, intelligence and fraud detection for years. We understand your data visualization challenges, and how to overcome them.
And we’re here for the long haul to help your projects evolve, improve and succeed.

Developers around the world love our toolkits.
They set the standard, with elegant APIs, user-friendly docs and quick-start examples to save you coding from scratch. Need technical support? The team that built the toolkits is on hand to help.
You get everything you need to build complex data visualization apps, fast.

We build toolkits for performance and scale, and have the metrics to prove it.
Their unrivaled functionality and unlimited customization options provide a beautiful visualization experience, 100% tailored to your users’ needs.