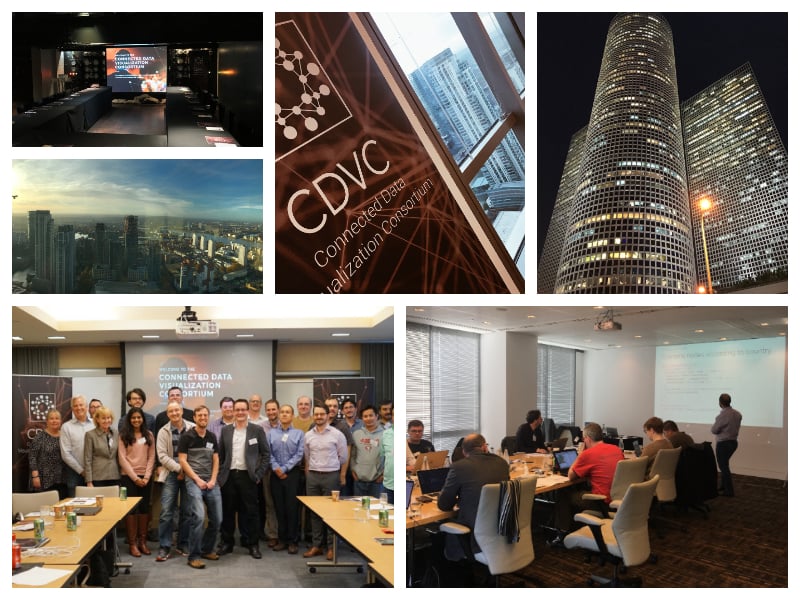
Connected Insights Seattle
April 9-10, 2025
April 9-10, 2025
Join us in Seattle for two days of learning and insights.
You'll hear directly from the expert team behind the Cambridge Intelligence toolkits, and learn from other trailblazing data visualization practitioners as we share experience and advice.
We'll also share our latest product features, plans for the future and previews of upcoming releases.


We'll meet at the Museum of Flight - a short drive from Seattle-Tacoma International Airport.
Wednesday, April 9, 2025 - 9.30am to 4.30pm
A technical training session for coders led by Cambridge Intelligence developers. The morning focuses on visualization techniques and core graph features for handling large datasets, while the afternoon features a collaborative hackathon.
Thursday, April 10, 2025 - 9.30am to 4.30pm
A day of discussions and presentations on the future of connected data visualization. Highlights include customer use case demos, new prototypes from our developers, and best practice tips from the team.
Seattle's Museum of Flight, the world's largest private air and space museum, features iconic aircraft like the first Boeing 747, a Lockheed M-21 Blackbird, and a British Airways Concorde.
We'll meet in the View Lounge, with panoramic views of Mouth Rainier.
How to get there
The museum website has more details about directions and parking.
Join day one for a free workshop, led by technical experts, open exclusively to developers using the KeyLines, ReGraph and KronoGraph toolkits.
Take time to meet and share experiences with other connected data visualization practitioners from all over Europe.
Get sneak previews of upcoming features and visualization techniques, and share your views on the future of Connected data visualization.
Technical training session
| 9.30 - 10.00 | Arrival, coffee and breakfast |
| 10.00 - 10.15 | Welcome and introductions |
| 10.15 - 11.00 | Training setup and workshop 1 |
| 11.00 - 11.20 | Morning coffee break |
| 11.20 - 13.00 | Workshop 2 |
| 13.00 - 14.00 | Lunch & networking |
| 14.00 - 15.00 | Hackathon |
| 15.00 - 15.30 | Afternoon coffee break |
| 15.30 - 16.00 | Team presentations and wrap-up |
| 16.00 - 17.00 | Optional guided tour of the museum |
Connected Insights meeting
| 9.30 - 10.00 | Arrival, coffee and breakfast |
| 10.00 - 10.25 | Welcome, introductions and the agenda |
| 10.25 - 11.00 | Product update - what's new and planned? |
| 11.00 - 11.20 | Morning coffee break |
| 11.20 - 12.15 | Technical session - geospatial visualization |
| 12.15 - 12.30 | Guest presentation |
| 12.30 - 13.00 | Feature requests and your feedback |
| 13.00 - 14.00 | Lunch & networking |
| 14.00 - 14.15 | Guest presentation |
| 14.15 - 15.00 | Technical session - time-dependent data |
| 15.00 - 15.30 | Afternoon coffee break |
| 15.30 - 16.20 | Data visualization tips & tricks |
| 16.20 - 16.30 | Meeting wrap-up |

Our connected Insights sessions bring together organizations using the Cambridge Intelligence suite of connected data visualization toolkits. They're a great opportunity to:
Attendance is limited, to help ensure everyone can have their voice heard in the conversation.
At a Connected Insights session, we aim to push the boundaries of connected data visualization, pooling expertise and experience to make advances in three key areas:
Designing experiences to help users make visual analysis part of their daily routine.
| Design effective workflows |
| Facilitate collaboration |
| Get user uptake |
| Encourage interactivity |
How to make the right data available, to the right people at the right time.
| Sources of graph data |
| Data federation and enrichment |
| Managing hairball datasets |
| Reducing chart clutter |
What will the next generation of data visualization applications look like?
| Sources of graph data |
| Data federation and enrichment |
| Managing hairball datasets |
| Create a vision of the future |