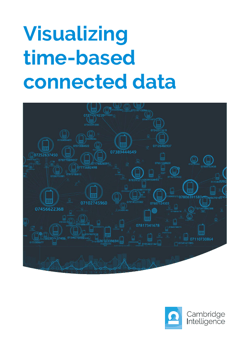
Visualizing time-based data
With graph and timeline visualization
With graph and timeline visualization
Data is rarely static. It evolves constantly as events happen, entities change, and connections form and break.
Analysts and investigators need to understand this evolution before they can ask the right questions, or draw accurate conclusions. To do that, they need the right tools.

"There is a growing market for visual tools that make big data accessible and simplify complexity. Cambridge Intelligence has the best technology to do that. Our partnership means we can consistently deliver outstanding software and expertise, keeping our customers happy and creating innovative solutions to their challenges.
Sistemi & Automazione
Hundreds of teams rely on our toolkits and cutting-edge innovation to power complex data user experiences in their products and applications.


